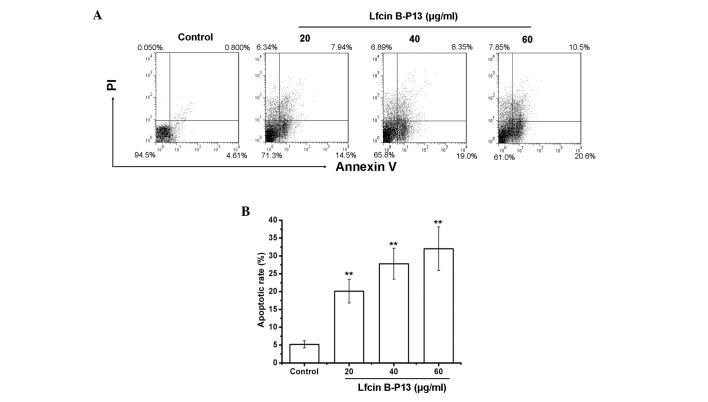
Figure 2.
LfcinB-P13 induces apoptosis in SMMC7721 cells. (A) Analysis of apoptosis in SMMC7721 cells was performed using flow cytometry and AV/PI double staining. Late apoptotic cells (AV and PI positive) are in Q2 and early apoptotic cells (AV positive and PI negative) are in Q3. Data points represent the distribution of apoptotic cell populations following treatment with LfcinB-P13 (0, 20, 40 and 60 µg/ml) for 24 h. LfcinB-P13-induced apoptosis in a dose-dependent manner. (B) Percentage of apoptotic cells. Values are presented as the mean ± standard deviation from three independent experiments. **P<0.01 vs. the control group. LfcinB-P13, bovine lactoferricin P13; AV, Annexin V; PI, propidium iodidQ, quadrant.

