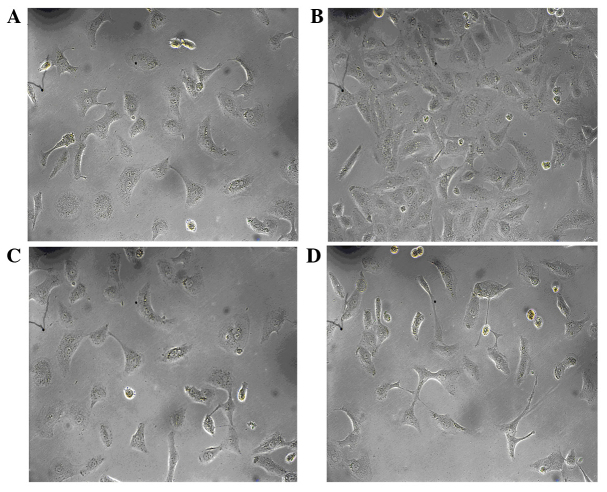
Figure 2.
Effect of allicin on high glucose-induced morphological changes in HK-2 cells at 48 h. Phase-contrast microscopy images are presented, showing the morphology of HK-2 cells following exposure to (A) normal glucose (control), (B) high glucose, (C) high glucose plus 20 µg/ml allicin or (D) high glucose plus 20 µmol/l PD98059. (magnification, ×200).

