
Figure 4. Plots of saccadic reaction time data.
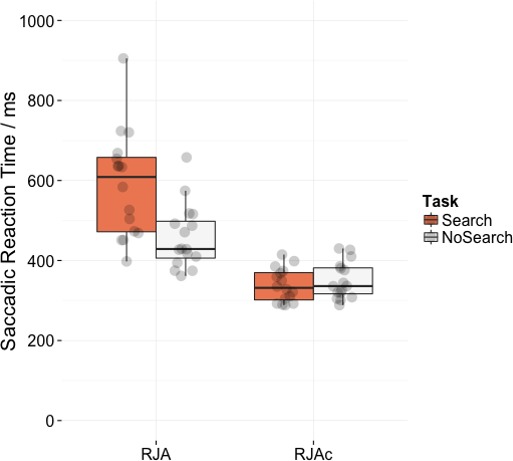
Box plots displaying saccadic reaction times in RJA and RJAc conditions, separated by task (i.e., Search, NoSearch). Data points represent individual participant means.
Official websites use .gov
A
.gov website belongs to an official
government organization in the United States.
Secure .gov websites use HTTPS
A lock (
) or https:// means you've safely
connected to the .gov website. Share sensitive
information only on official, secure websites.
Box plots displaying saccadic reaction times in RJA and RJAc conditions, separated by task (i.e., Search, NoSearch). Data points represent individual participant means.