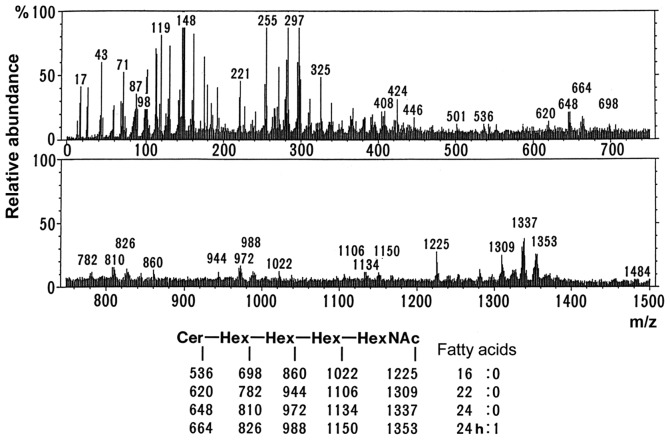
Figure 6.
Negative ion fast atom bombardment mass spectrometry spectra of G2 that correspond to glycolipids in Fig. 2A, from poorly differentiated adenocarcinoma. Approximately 5 µg each of the glycolipids in G2 were mixed in triethanolamine and then analyzed with a mass spectrometer (JMSHX-110; JEOL, Ltd.). The molecular ion peaks shown in the lower part of Fig. 6 indicated that the structure was Cer-Hex-Hex-Hex-HexNAc (being Cer, ceramide; Hex, hexose; and HexNAc, N-acetylhexoseamine). These results suggested that the sugar chains of the G1 and G2 bands were globotetraosylceramide. h, hydroxy fatty acids.

