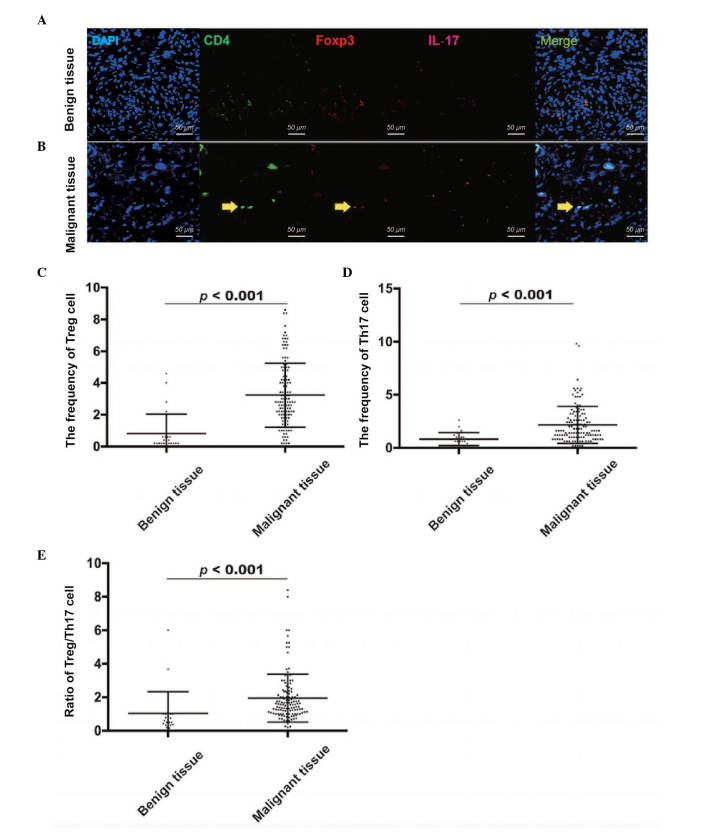
Figure 2.
Expression of Treg cells and Th17 cells using immunofluorescence staining. (A) Treg cells or Th17 cells were stained by DAPI (Blue), CD4 (Green) and Foxp3 (Red; IL-17 for Th17 cells) in benign tumor tissues. (B) Treg cells or Th17 cells were stained by DAPI (Blue), CD4 (Green) and Foxp3 (Red; IL-17 for Th17 cells) in EOC tissues. The yellow arrows indicate TAMs. The frequency of (C) Treg cells, frequency of (D) Th17 cells and (E) ratio of Treg/Th17 cells were significantly higher in EOC tissues, compared with the benign tumor tissues. Scale bar=50 µm. EOC, epithelial ovarian cancer; TAM, tumor-associated macrophage; Treg, regulatory T cell; Th17, T helper cell 17; IL-17: interleukin 17.

