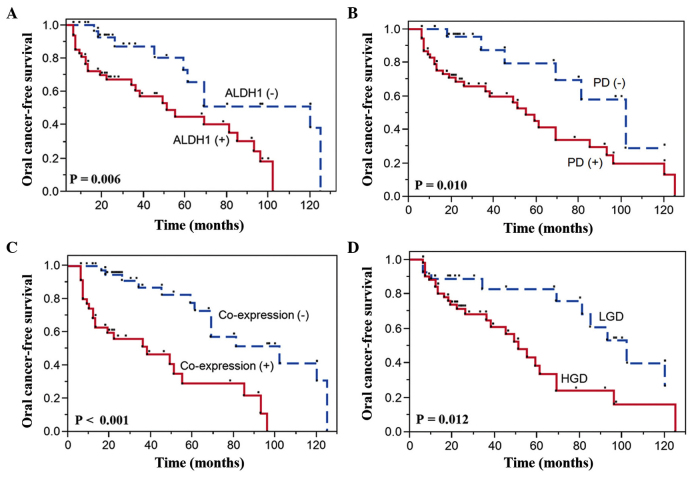
Figure 3.
Kaplan-Meier oral cancer-free survival curves according to (A) ALDH1 negativity and positivity; (B) podoplanin negativity and positivity; (C) presence or absence of co-expression of ALDH1 and podoplanin; and (D) degree of dysplasia. Comparisons were performed using the log-rank test. ALDH1, aldehyde dehydrogenase 1; PD, podoplanin; LGD, low-grade dysplasia; HGD, high-grade dysplasia.

