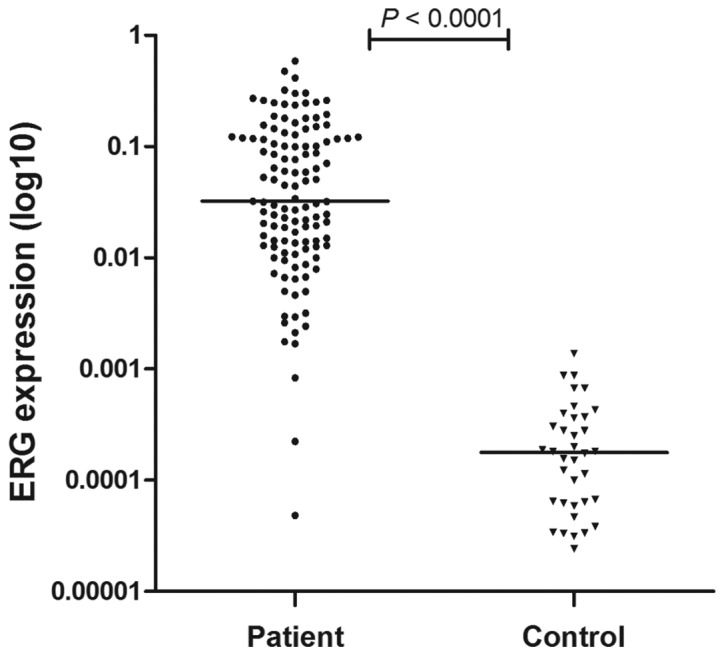
Figure 1.

ERG expression levels in 119 pediatric ALL patients and 36 controls. An independent samples t-test was used for the comparisons of ERG expression levels between two groups, using the 2µ(ΔCT) values as ERG quantitative expression levels. The line indicates the median value. ERG expression levels demonstrated a significant difference between childhood ALL patients and controls (P<0.0001). ERG, ETS-related gene; ALL, acute lymphoblastic leukemia.
