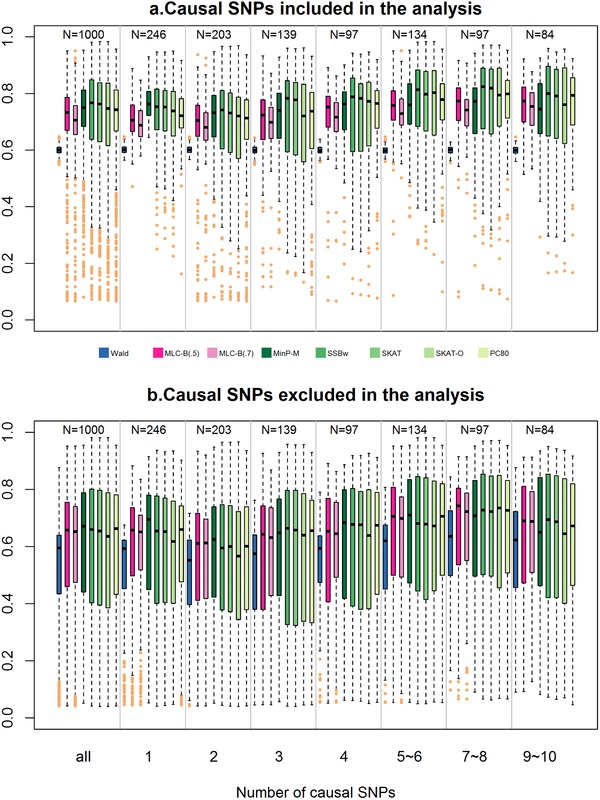
Figure 3.

Simulation study results (Model 6): Distribution of gene‐specific empirical power of MLC‐B(c = 0.5 and 0.7) and other gene‐based statistics obtained for 1,000 genes at nominal level α = 0.05 stratified by the number of causal SNPs. The box plot shows five points: median, first, and third quartiles computed using Tukey's “hinges” and end points of whiskers. The whiskers extend to the most extreme values no more than 1.5 times the interquartile range. Outliers are shown in sand color. Note that the simulation error variance was adjusted separately for each gene to obtain 60% Wald test power in a sample size of n = 1,000 assuming the regression analysis includes causal SNPs. Upper panel (a) causal SNPs included in the regression analysis; lower panel (b) causal SNPs excluded from the regression analysis
