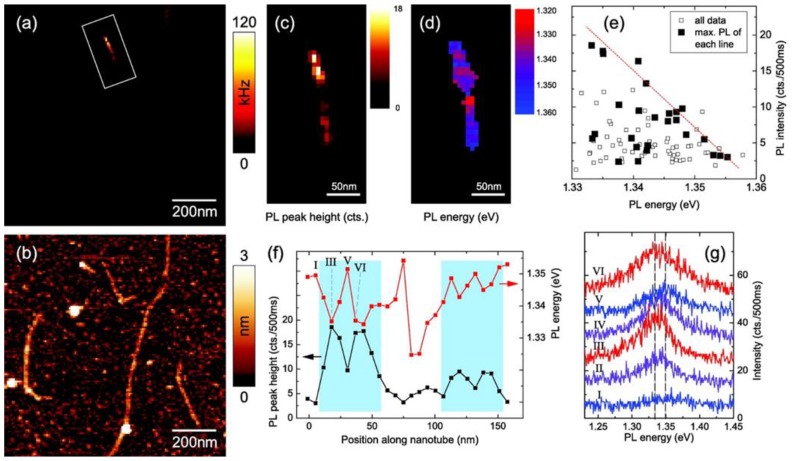
Figure 6.
Exciton localization in a 160 nm long (9,1) SWNT. (a,b) Near-field photoluminescence (PL) image and corresponding topography showing several luminescent nanotubes; (c,d) Maps of the PL intensity and energy derived from a subsequent spectroscopic image of the area marked in panel (a) by peak fitting the recorded spectra at each image pixel; (e) Correlation between PL intensity and energy for all image pixels (open squares), with the brightest pixel of each image line being highlighted (filled squares) to account for the influence of finite spatial resolution (see text); (f) PL intensity and energy plotted along the nanotube; (g) Near-field spectra from six adjacent positions (I–VI) along the nanotube, equally spaced by 6.5 nm and marked in panel (e). The PL energy shifts by up to 15 meV (range indicated by the two dashed lines) between two neighboring positions (reprinted from reference [92] with permission).

