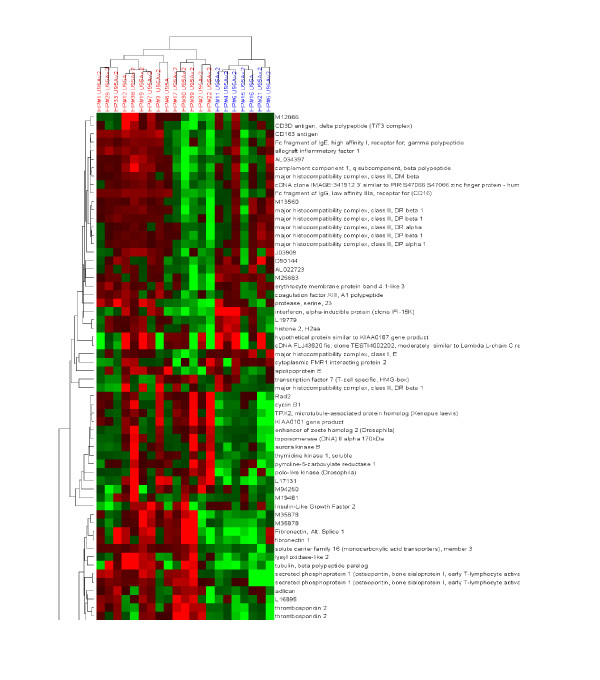
Figure 6.
Hierarchical clustering of Affymetrix gene expression data as described in the legend to figure 5, with the exception that genes are also clustered based upon similarity in expression across the samples. In this fashion, correlations between samples and genes can be simultaneously observed.

