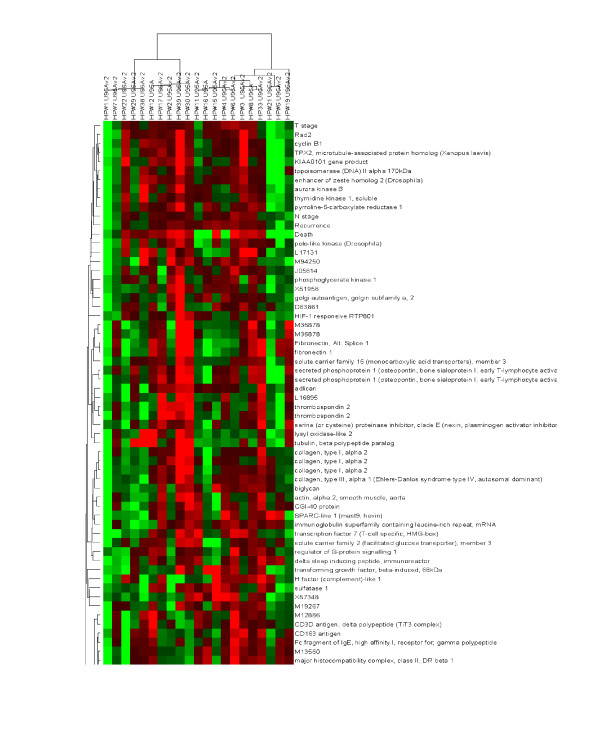
Figure 8.
Clustering of samples based upon integrated clinical, experimental and molecular attributes. In this sense, molecular-clinical (genotype-phenotype) associations can be readily observed. As described in the legend to Figure 7, the extent of the clinical/molecular attribute is represented on the same normalized scale, such that red and green represent relatively high and low values respectively.

