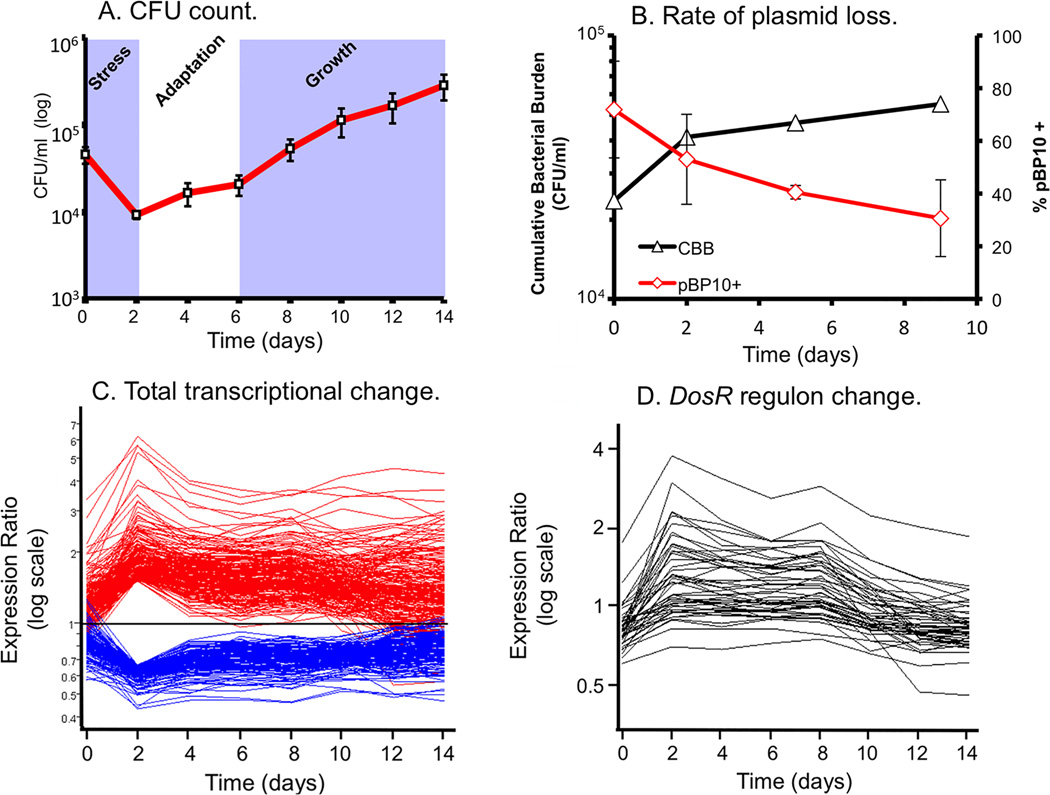
Figure 1. Life and death dynamics during long-term intracellular survival of M. tuberculosis.
(A) Survival Assays. Resting murine bone-marrow derived macrophages were infected at low MOI (~1:1) with M. tuberculosis CDC1551. Viable CFU were quantified at day 0 and at 2 day intervals post-infection (p.i.) over a 14-day time-course by lysis of monolayers, serial dilution, and plating on 7H10 medium. Error bars indicate standard error of the mean. (B) Replication Clock Plasmid. The percentage of bacteria containing the pBP10 plasmid during growth in resting macrophages was determined by comparing CFU (mean ± s.d.) recovered on kanamycin vs. nonselective media (red). The cumulative bacterial burden (CBB) (black) was determined by mathematical modeling based on total viable CFU and plasmid frequency data. Data shown represents two independent experiments. (C) The “bottleneck” response. Temporal expression profiles of genes differentially regulated at Day 2 p.i., including genes from (A) that were up- (red) or down-regulated (blue) >1.5-fold (shown as ratio of signal intensity relative to control). Note the maximal change in transcript levels at day 2 p.i. followed by majority trending back towards control levels. (D) “Guilt by association” analysis. Genes regulated in synch with known virulence regulons – i.e. the DosR regulon - were identified by using a highly regulated member of this regulon, hspX, in place of synthetic profiles. This figure is reproduced from Rohde et al. (24).

