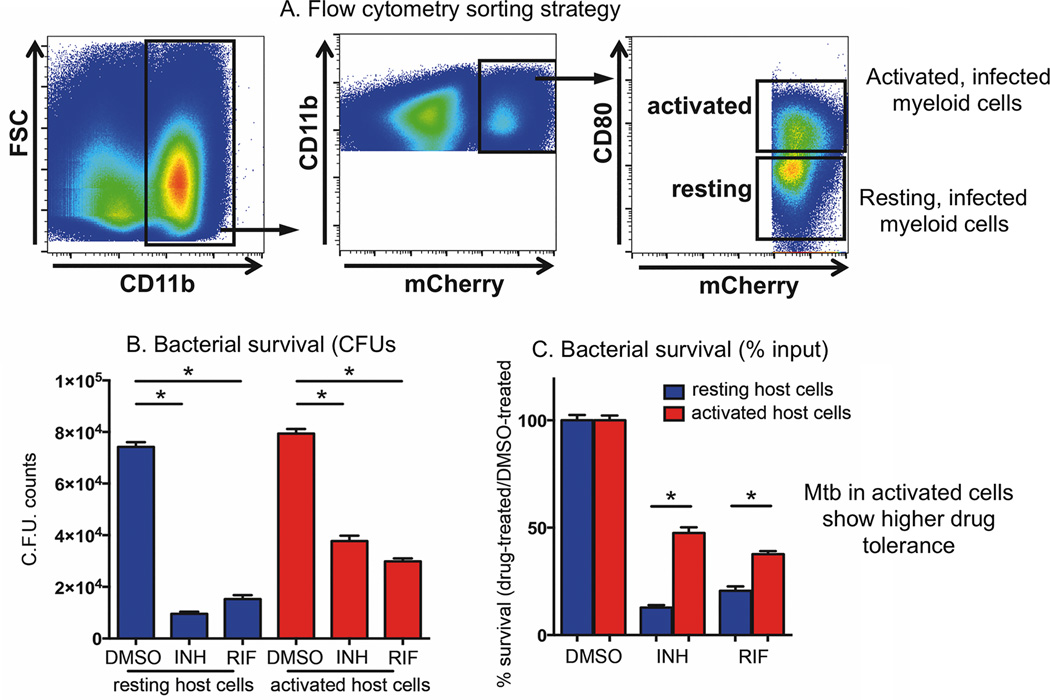
Figure 3. Flow sorting of activated and resting M. tuberculosis-infected host cells demonstrates that the drug sensitivity of M. tuberculosis recovered from in vivo infection correlates inversely with the immune activation status of the host phagocyte.
(A–C) M. tuberculosis recovered from activated host cells in vivo were more tolerant to both INH and RIF than those recovered from resting host cells. C57BL/6J mice were infected with mCherry-expressing M. tuberculosis Erdman for 21 days, and M. tuberculosis-containing myeloid cells with different immune activation status isolated from lung tissue using flow cytometry. (A) CD11b+ mCherry+ CD80high cells (activated population) and CD11b+ mCherry+ CD80low cells (resting population) were sorted according to the depicted gating strategies. (B–C) Isolated cells were established in culture and subjected to treatment with 1 µg/ml INH or RIF, or an equivalent volume of DMSO. Following 24 h drug treatment, bacterial survival was determined by CFU enumeration (B), and the percentage of M. tuberculosis surviving drug treatment quantified by normalizing bacterial load in drug-treated samples against that in DMSO-treated samples (C). This figure is modified from the work of Lui et al, (34).

