Figure 8.
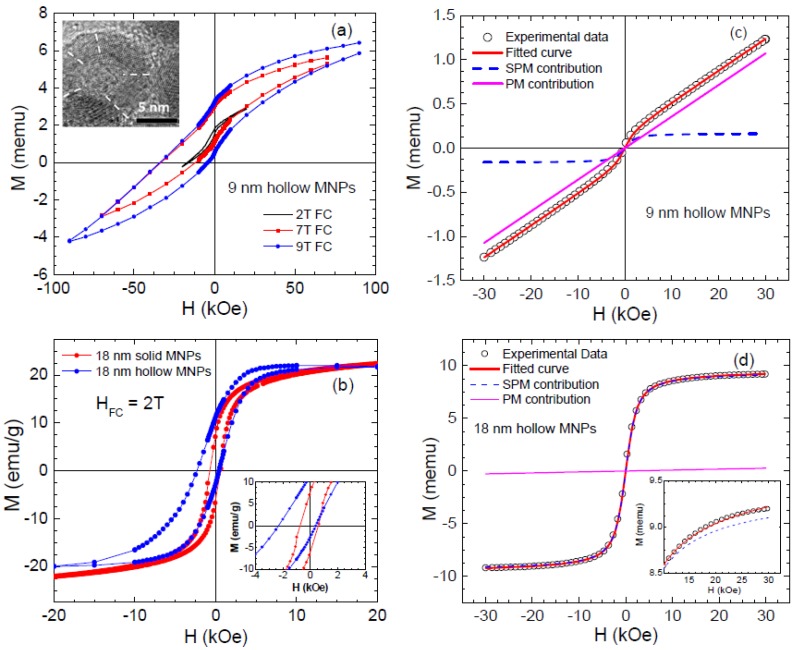
The field-cooled (FC) M-H loops taken at 5 K for (a) 9 nm hollow nanoparticles for different cooling fields of 2 T, 7 T and 9 T; and (b) 18 nm solid and hollow nanoparticles for a cooling field of 2 T; An enlarged portion of the FC M-H curves is shown in the inset of Figure 8b. The M-H curves at 300 K are fitted (red) to Equation (3); The blue and magenta (dashed) curves represent the simulated superparamagnetic (SPM) and paramagnetic (PM) contributions extracted from the experimental data using the fitting parameters for the (c) 9 nm and (d) 18 nm hollow nanoparticles. Reproduced with permission from [41]. Copyright AIP Publishing, 2012.

