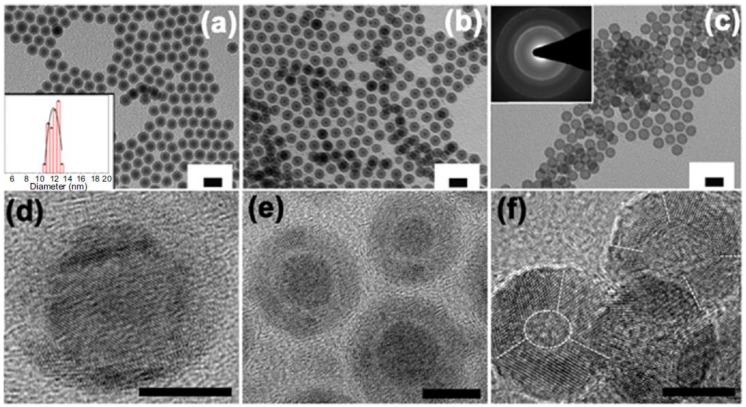
Figure B2.
Bright-field TEM images of the 12 nm Fe/γ-Fe2O3 (a) core/shell, (b) core/void/shell, and (c) hollow nanoparticles; inset of (a) shows a histogram of the particle size populations for the 12 nm core/shell nanoparticles and inset of (c) shows a selected area electron diffraction pattern of the hollow nanoparticles. HRTEM images of (d) core/shell, (e) core/void/shell and (f) hollow nanoparticles. The scale bar is 20 nm in (a–c) and is 5 nm in (d–f). The discontinuous lines in (f) show grain boundaries of nanograins in the hollow nanoparticles. Reproduced with permission from [43]. Copyright IOP Publishing, 2015.

