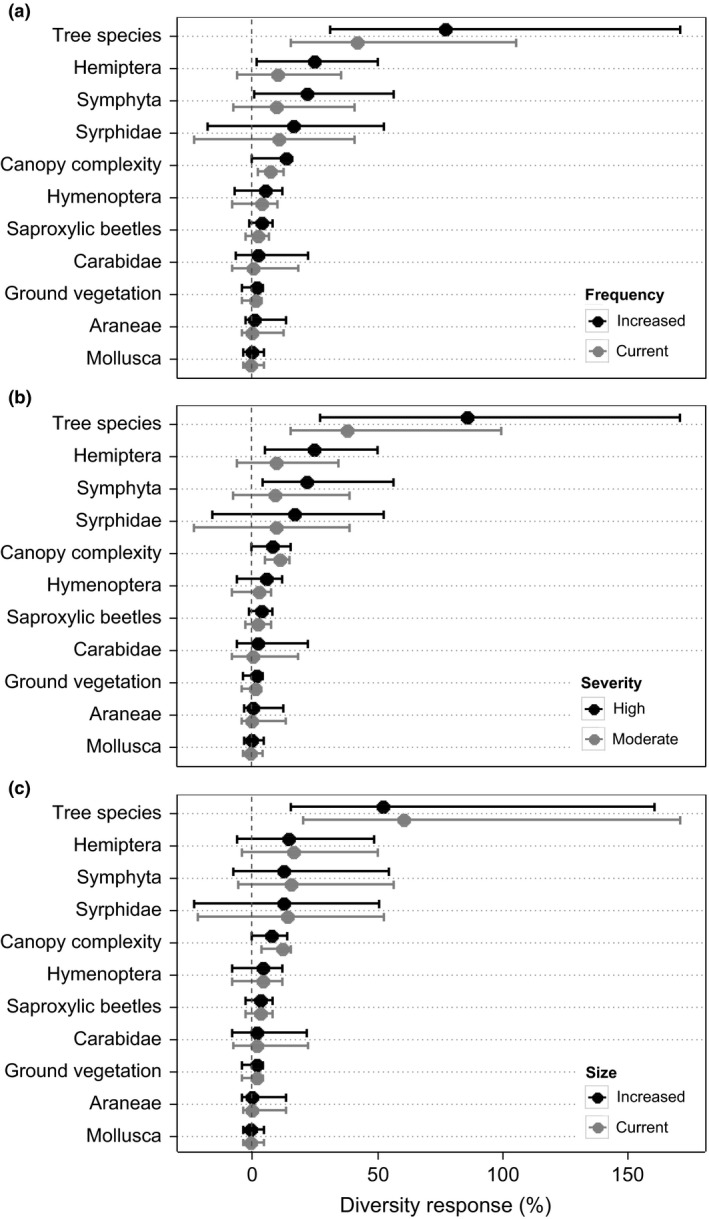
Figure 3.

Response of biodiversity indicators to disturbance (a) frequency, (b) severity and (c) size relative to scenarios without disturbance (zero line) at the end of the 1000‐year simulation period. Dots are median values and whiskers indicate the 95th percentile range across all scenarios. Positive values indicate an increase in diversity.
