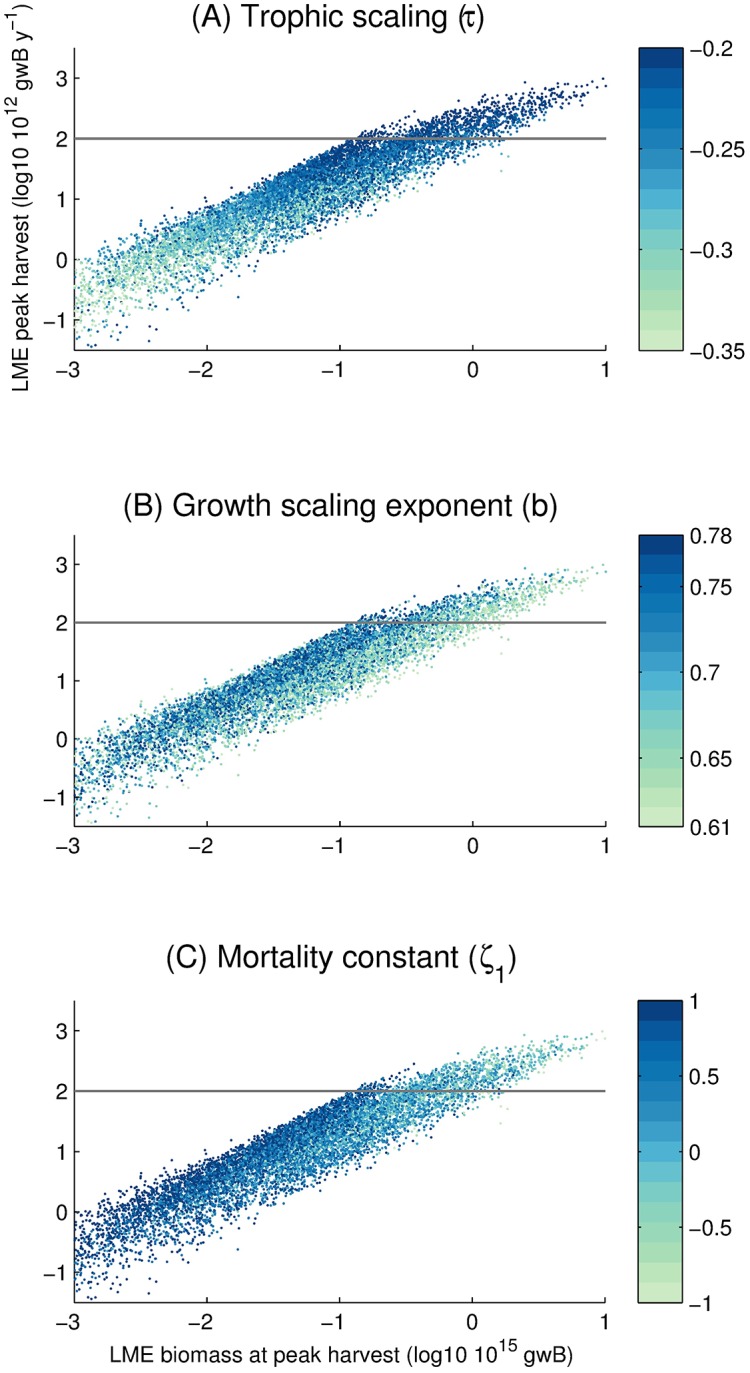
Fig 4. Summary results of Monte Carlo simulations.

Horizontal and vertical axes as in Fig 3. Circle color represents (A) Trophic scaling τ, (B) Allometric growth scaling constant b, or (C) Mortality constant ζ1. The grey line represents a reference global harvest of 100 × 1012 gwB y−1.
