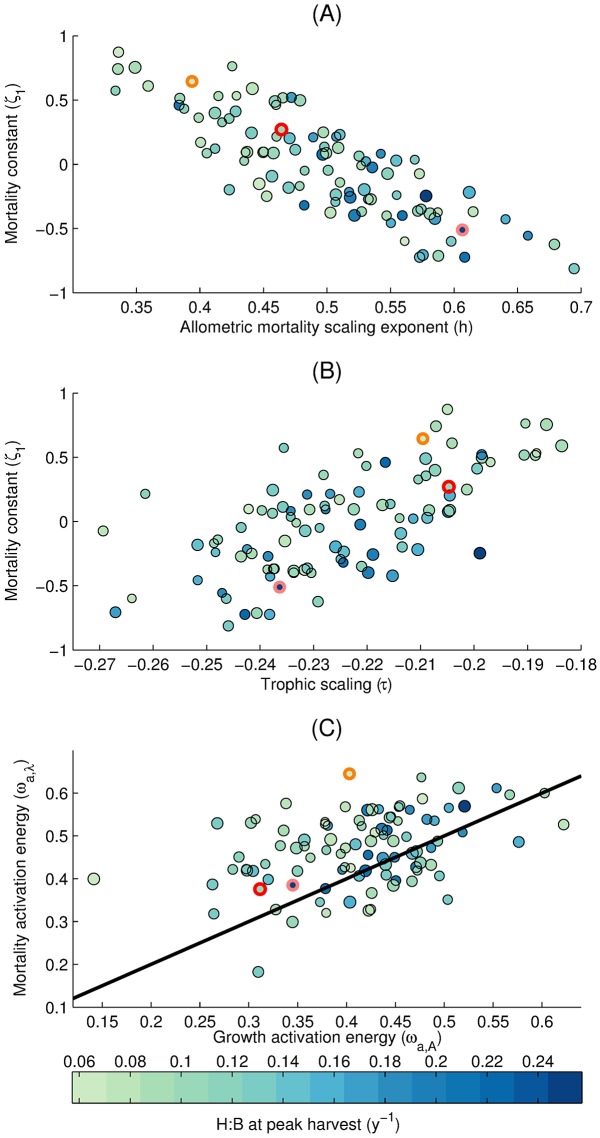
Fig 9. Harvest to biomass ratio (H:B) at peak harvest in terms of three sets of parameter combinations.
Circles are members of the optimized set of model parameters. Circle color represents the H:B (y−1) calculated as the total harvest () over the total biomass at the year of global peak harvest integrated over the LMEs, while the circle size is proportional to the peak harvest. Horizontal and vertical axes correspond to parameter values from the Monte Carlo suite. Thick orange, red, and peach circles correspond to the low, medium, and high H:B members that are used in Fig 10. The black line in (C) is the identity line (1:1 line).

