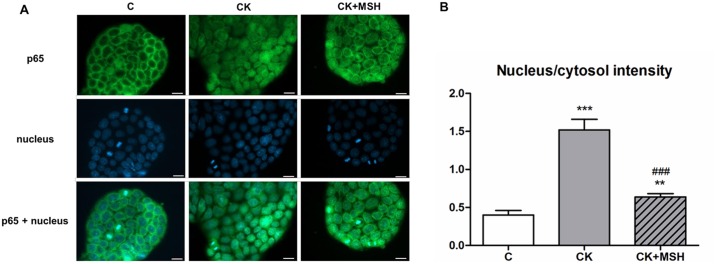
Fig 5. Immunohistochemical staining and analysis of NF-κB activation in cytokine- and α-MSH-treated Caco-2 cells.
(5A) Caco-2 cells were treated for 30 minutes with culture medium (C), cytokines (CK; 50 ng/ml TNF-α and 25 ng/ml IL-1β), or cytokines and 10−8 M α-MSH (CK+MSH). Nuclear localization of the NF-κB p65 subunit was monitored by immunostaining. Cell nuclei were labeled with Hoechst 33342. Green: p65 staining; blue: cell nuclei. Scale bar: 10 μm. (5B) Ratio of the fluorescence intensity of the NF-κB immunostaining in cell nuclei and cytoplasm. Means ± S.D., n = 8–10, ***P < 0.001, **P<0.01, ###P<0.001. *: CK, CK+MSH compared to C; #: CK+MSH compared to CK.

