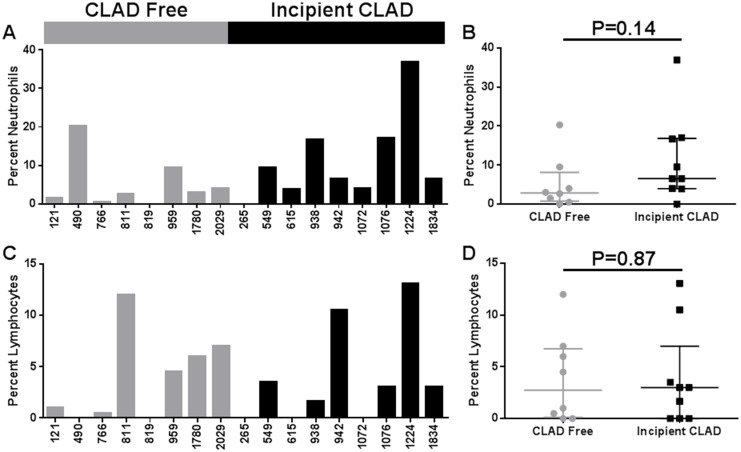
Fig 2. BAL cell differential.
(A) Percentage of neutrophils among the BAL cells by sample. (B) Percent neutrophils analysis (Mann Whitney test) by CLAD Free versus Incipient CLAD group. (C) Percentage of lymphocytes among the BAL cells by sample. (D) Percent lymphocytes analysis (Mann Whitney test) by CLAD Free versus Incipient CLAD group.

