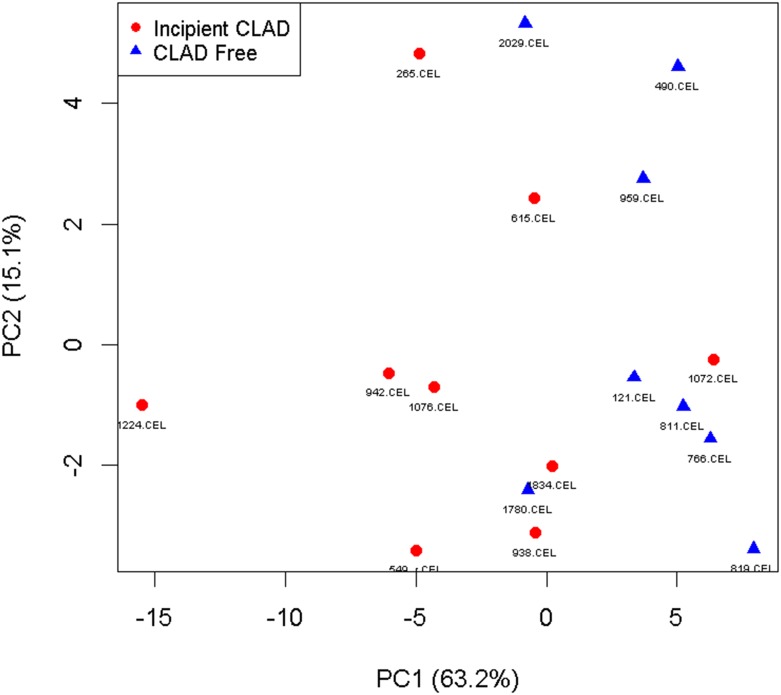
Fig 4. Principal component analysis.
Principal component analysis based on the 40 differentially expressed candidate genes demonstrates modest separation of incipient CLAD and CLAD free groups. The percentage of total variance accounted for by the first principal component was 63.2%, and for the second principal component was 15.1%.

