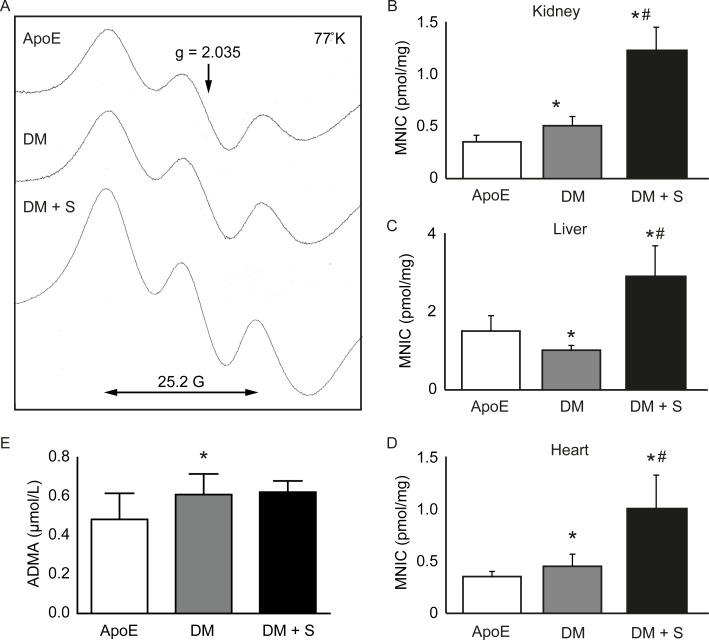
Fig 2. Tissue-dependent variation in NO free radical induction.
(A) EPR spectrum of frozen kidney samples. The characteristic triplet structure of the mononitrosyl-iron complex (MNIC, double-headed arrow) centers around g = 2.035 and represents the formation of local nitric oxide in 334–370 mg tissue. (B-D) Quantification of nitric oxide formation in kidney, liver and heart tissue, shown as mean pmol MNIC / mg wet tissue ± SD, n = 7–9. E) Plasma ADMA concentrations, shows as mean ± SD, n = 8. *P<0.05, compared with ApoE; #P<0.05 compared with DM. ApoE = ApoE KO mice, DM = diabetic apoE KO mice, DM + S = diabetic apoE KO mice + sepiapterin.

