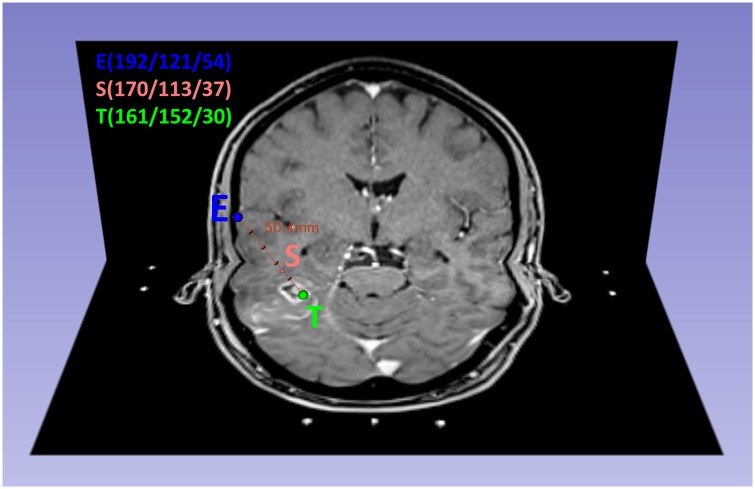
Fig 1. Calculation of the biopsy point S that is located in the enhancing tumor area (CE).
Combination of an axial and a coronal slide of intraoperative cT1 MRI in a 60-year-old patient with glioblastoma. Cranial view. The biopsy point S is marked within the NE-area of the tumor. The trajectory (red line, length: 50.4mm) and the biopsy point S (170/113/37) were calculated via vector analysis in MATLAB from the coordinates of the known entry point E (192/121/54) and the target point T (161/152/30). The distance between S and T was 15.0 mm.

