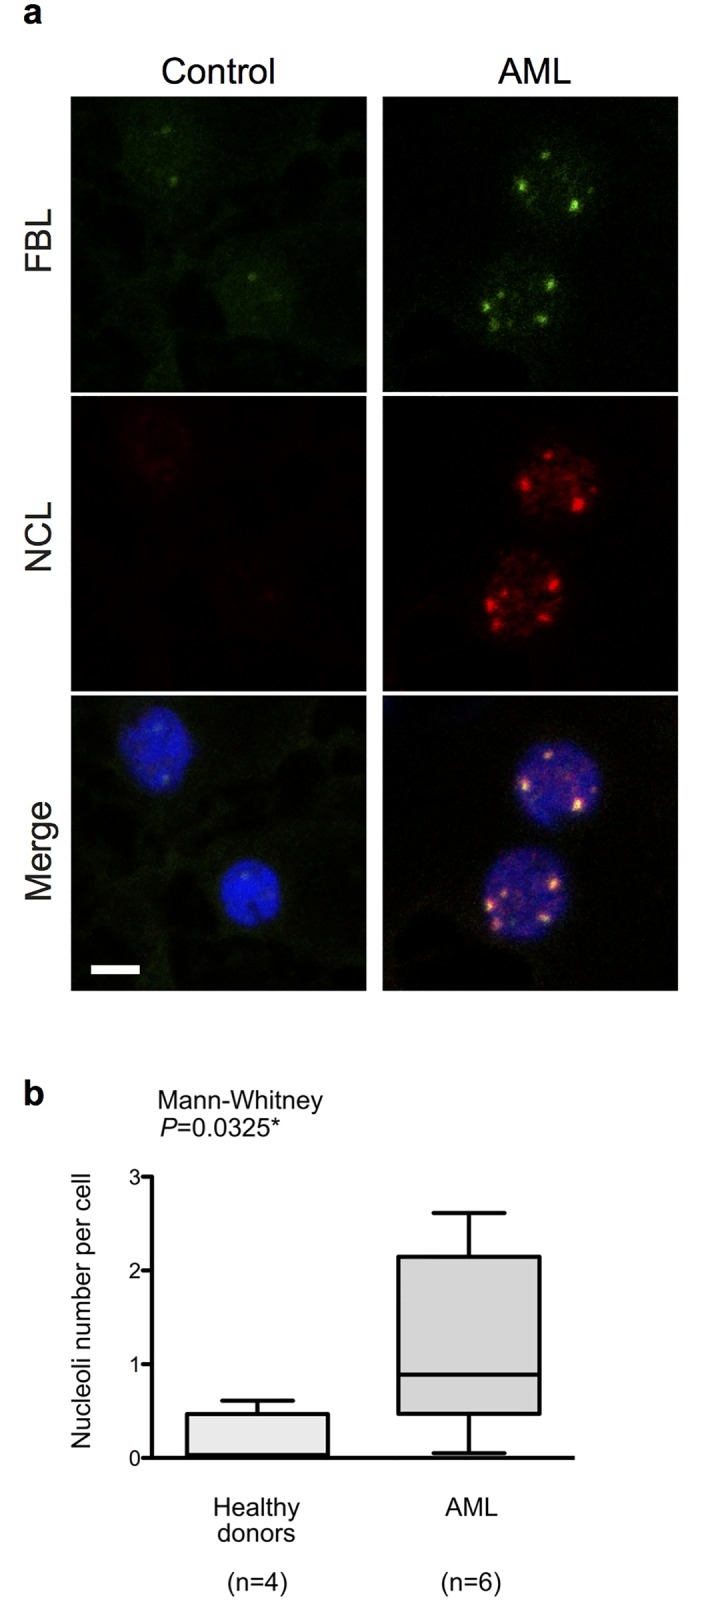
Fig 1. Increase in nucleoli number and size in AML patients.

(A) Immunofluorescence staining of nucleolar fibrillarin (FBL) and nucleolin (NCL) in healthy donors (control) and AML patients bone marrow smears. FBL (green) and NCL (red) patterns are shown individually in top and middle images, and merge image with nuclei staining (blue) is shown in the bottom. Images were collected using confocal microscope (scale = 10μm). (B) Number of nucleoli per cell, quantified by image analysis from 4 control and 6 AML smears. Box and whisker plots represents median (middle horizontal bar), inter-quartile range (bottom and top of the box) and minimal/maximal values (bottom and top of the whiskers) of nucleoli number per cell. Representative panels of images used to perform these image analyses for each individual are shown in S2 Fig. n: number of samples; *: P<0.05.
