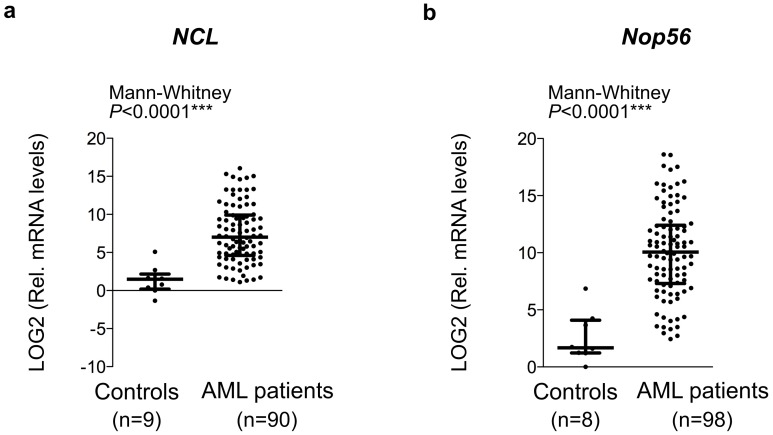
Fig 2. Over-expression of NCL and NOP56, two ribosome biogenesis factors, in AML blasts.
(A-B) Mean comparisons of NCL (A) and NOP56 (B) gene expression between controls and AML patients were compared using the Mann-Whitney test. Log2 (Relative RNA levels) were determined using high-throughput qPCR in series 2. Graphs represents median (middle horizontal bar) and inter-quartile range (bottom and top bars) calculated on the log2 (Relative RNA levels) of each individual sample (grey dot). n: number of samples; ***: P<0.0001.

