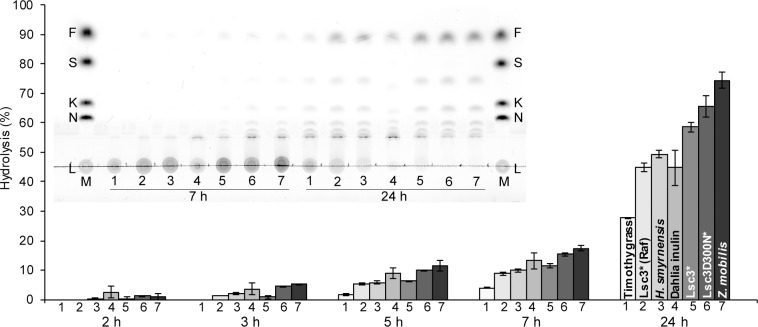
Fig 9. Acid-resistance of levans and dahlia inulin.
Fructans (10 g/L) were incubated in 0.01 M hydrochloric acid (pH 2.0) at 37°C for 24 h and sampled over this period for reducing sugar and thin layer chromatography (TLC) analysis. The bars indicate the extent of hydrolysis of the fructan calculated as percentage of released reducing sugars from the total amount of reducing sugars in completely hydrolysed sample. Standard deviation values shown on bars are calculated from at least two independent experiments with at least two parallel samples. TLC shows fructan hydrolysis products at 7 and 24 h of incubation. Samples spotted onto a TLC plate are numbered from 1 to 7 according to respective numbers on the bar diagramme. The chromatogram was developed in chloroform: acetic acid: water (60:70:10; v/v/v). Sugar markers (M) on TLC: 7 g/L levan (L), 8 mM nystose (N), 8 mM 1-kestose (K), 30 mM sucrose (S) and 30 mM fructose (F). Details of the methods are presented in Materials and Methods section.

