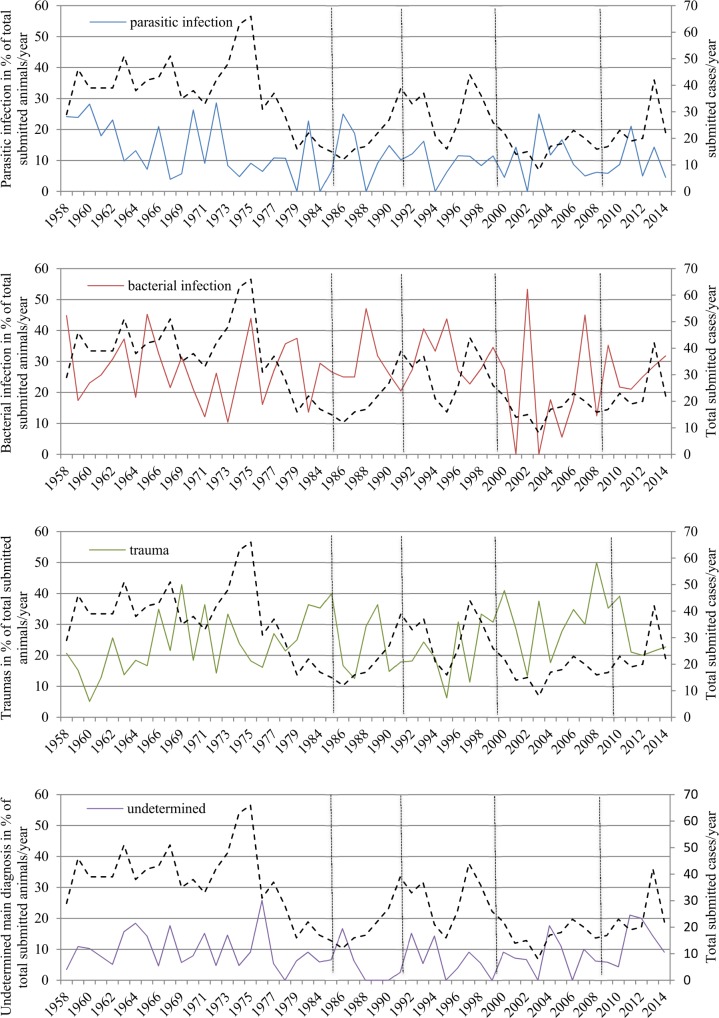
Fig 7. Selected categories of main diagnoses in percentage of total submitted cases per year.
(A) Parasitic. (B) Bacterial. (C) Traumatic. (D) Undetermined. Dashed horizontal black lines indicate total number of submitted cases. Vertical dotted lines separate time periods with different main pathologists.

