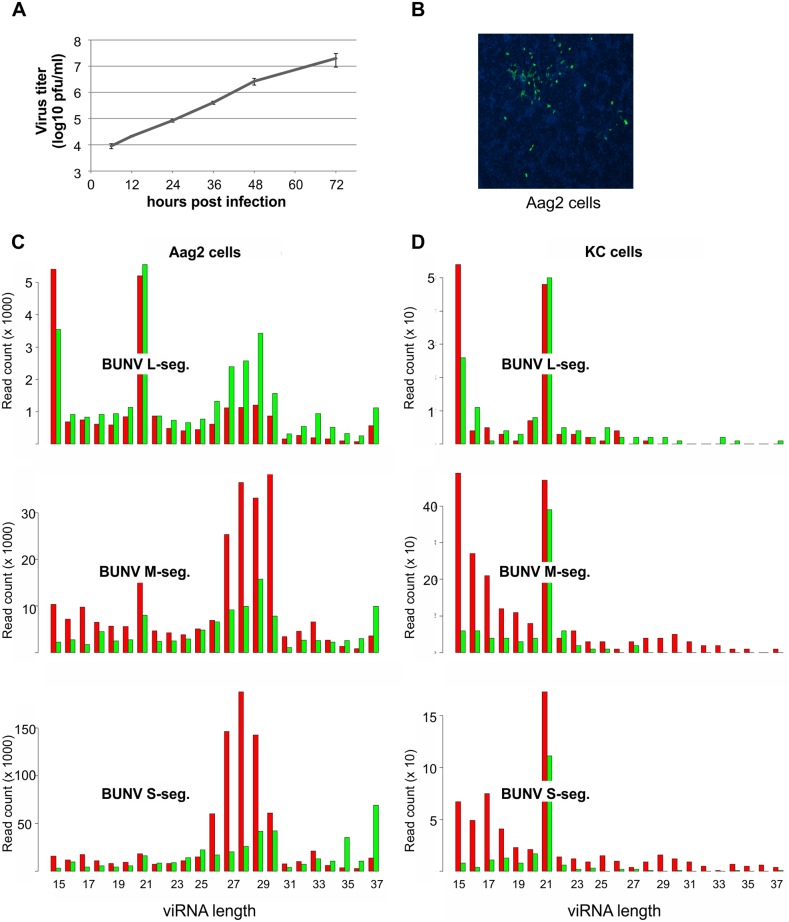
Fig 1. BUNV growth and BUNV-specific viRNA production in Aag2 cells.
(A) BUNV growth curve following infection of Aag2 cells at MOI 1, determined by plaque assay. (B) Immunofluorescence of BUNV-infected Aag2 cells (MOI 0.01) at 48 hours p.i., using BUNV-N specific primary antibody and Alexa 488-conjugated anti-rabbit-IgG secondary antibody (green). Nucleus stained by Dapi (blue). (C) BUNV-specific small RNAs produced in infected Aag2 cells at 24 hours p.i. against L, M and S segments. The y axis indicates read frequency; the x axis indicates the length of the small RNAs (nt). Red indicates the small RNAs mapping to the antigenome and green the small RNAs mapping to the genome. (D) BUNV-specific small RNAs produced in infected KC cells at 48 hours p.i. against L, M and S segments. The y axis indicates read frequency; the x axis indicates the length of the small RNAs. Red indicates the small RNAs mapping to the antigenome and green the small RNAs mapping to the genome.

