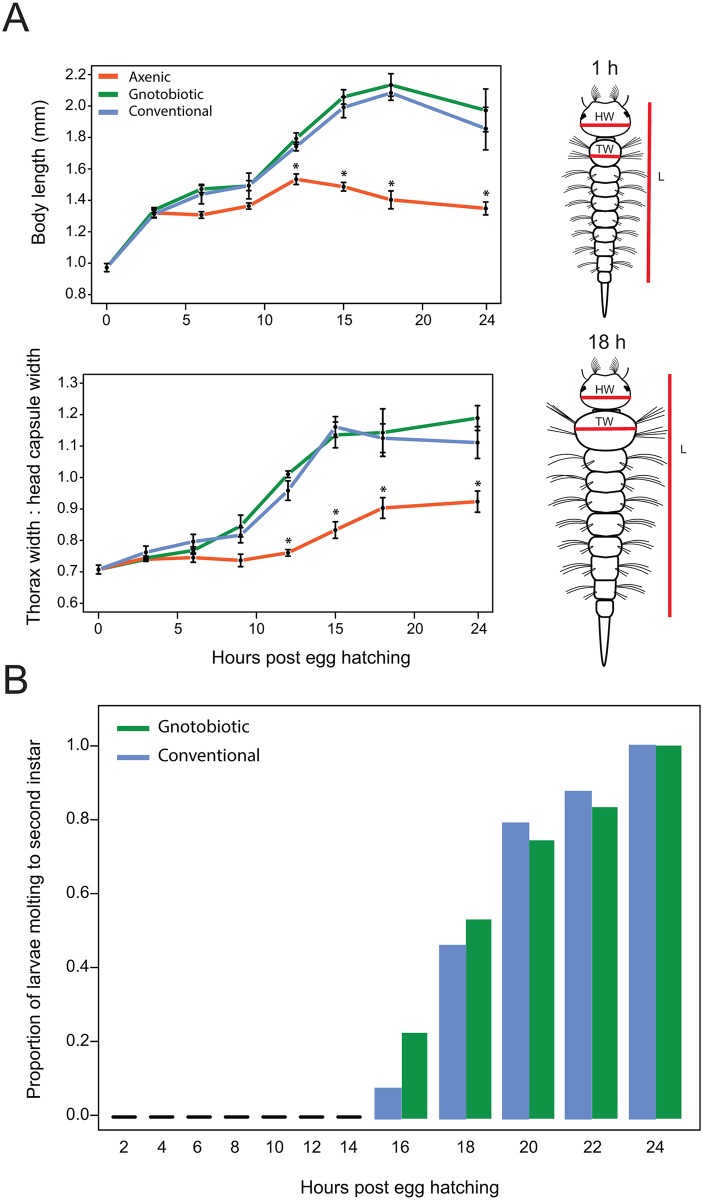
Fig 1. Growth of axenic, gnotobiotic and conventional Ae. aegypti as first instars.
(A) Mean body length (upper graph) and the ratio of thorax width: head capsule width (lower graph) for each treatment from the time of hatching (0 h) to 24 h. A minimum of 6 individuals was measured at each time point per treatment. Each data point indicates mean value ± the standard error (SE). ANOVA analyses were conducted separately for each time point with multiple comparisons performed by Tukey-Kramer HSD test. Conventional and gnotobiotic larvae did not differ for either size measure at any time point. An asterisk (*) indicates the time points where axenic larvae significantly differ from the gnotobiotic and conventional treatments (P ≤ 0.01). To the right of each graph are drawings of 1 and 18 h post-hatching first instars showing where length (L), head capsule width (HW) and thorax width (TW) were measured. (B) Proportion of gnotobiotic and conventional larvae that molt to the second instar after transfer to wells containing water but no food. Individual larvae from each treatment were removed from culture plates containing food at two hour intervals, rinsed 3x in sterile water, and transferred to wells of a 24-well culture plate containing sterile water only. The proportion of larvae molting to the second instar was recorded at 36 h post-hatching. A minimum of 24 individuals was assayed for each treatment per time point. There were no differences between the proportion of gnotobiotic and conventional larvae that molted at any time point (Fisher’s exact test: P > 0.05).

