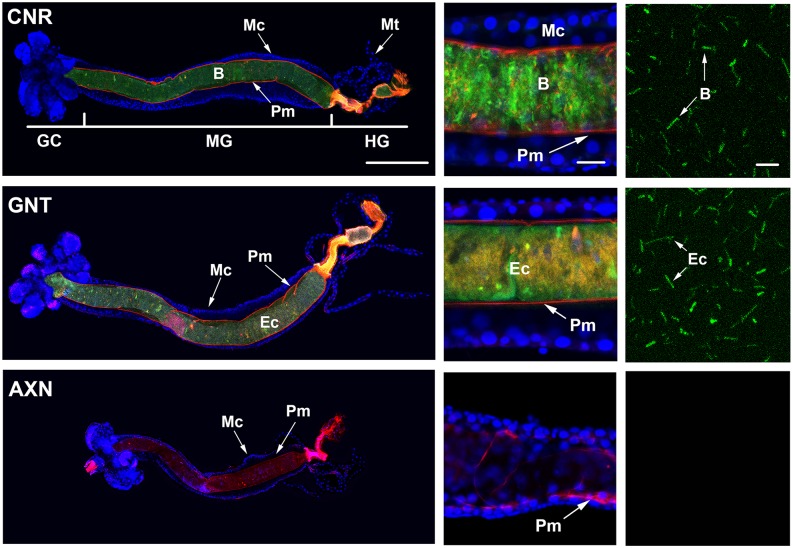
Fig 3. Representative images of digestive tracts from conventional (CNR), gnotobiotic (GNT) and axenic (AXN) larvae at 18 h post-hatching.
The left panels show low magnification images of guts from CNR (top), GNT (middle) and AXN (bottom) larvae. The foregut was removed in each image resulting in gastric caecae (GC), midgut (MG) and hindgut (HG) being oriented from left to right. Cell nuclei were stained with Hoechst 55532 (blue) while the peritrophic matrix (Pm) was stained with a Cy3 labeled chitin binding protein (red). Midgut cell nuclei (Mc) and the Malpighian tubules are indicated. A peptidoglycan primary antibody visualized by an Alexafluor 488 secondary antibody (green) labeled bacteria (B) in the digestive tract of CNR larvae or E. coli (Ec) in gnotobiotic larvae. Note the absence of a peptidoglycan signal in AXN larvae. Scale bar in the CNR panel equals 200 μm. The middle panels show higher magnification images of the midgut for each treatment. Note that the peptidoglycan signal for bacteria (B) in the CNR treatment and E. coli (Ec) in the GNT treatment is within the endoperitrophic space formed by the Pm, whereas no signal is visible in the AXN treatment. Scale bar in the upper middle panel equals 20 μm. The right panels show high magnification images for the anti-peptidoglycan signal inside the endoperitrophic space of each treatment. This signal is predominantly associated with rod-shaped bacteria (B) in the CNR treatment and rod shaped E. coli (Ec) in the GNT treatment. No signal is detected in the AXN treatment. Scale bar in the upper panel equals 5 μm.

