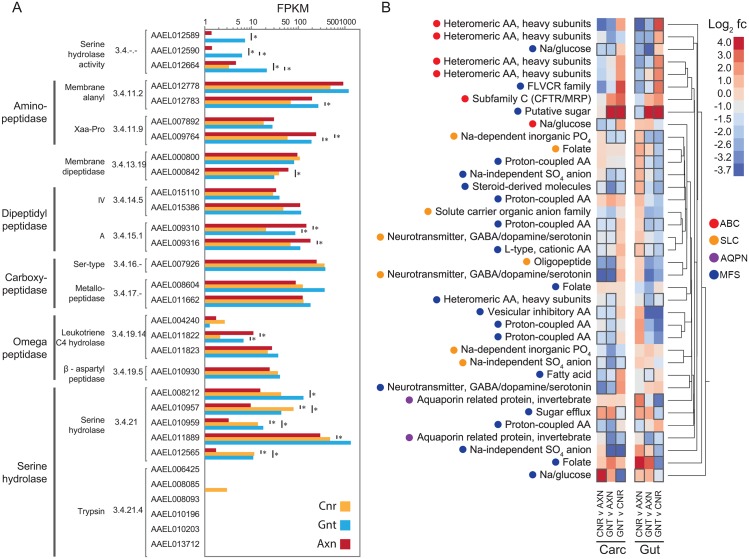
Fig 5. Expression of peptidase and transporter genes in the guts and carcasses of conventional (CNR), gnotobiotic (GNT) and axenic (AXN) larvae.
(A) Peptidase genes with mean FPKM values > 5 in the guts of CNR, GNT or AXN larvae are presented with asterisks and underline bars indicating transcript abundances that significantly differ between particular treatments. The genes shown along the y-axis are identified by VectorBase accession and enzyme commission (E.C.) classification. At the bottom of the y axis is shown a subset of trypsin-like peptidases previously identified to be expressed in adult female Ae. aegypti and play important roles in blood meal digestion (see text). Note that most of these trypsin-like peptidases are not expressed in first instars. (B) Hierarchical clustering analysis and heatmap of expression for transmembrane transporter genes. Each column in the heatmap designates pair-wise comparisons between treatments (CNR, GNT or AXN) for either the carcass (Carc) or gut. Genes more abundantly expressed in the first condition listed at the bottom of a given column are denoted by red colors, while those more abundantly expressed in the second condition are denoted by blue colors. Color range in the heatmap indicates log2 fold change (fc). Gene names are listed to the left of each row while hierarchical clustering is indicated by the tree to the right of the heatmap. Colored circles denote membrane transport protein membership: ATP-binding cassette (ABC), solute carrier family (SLC), aquaporin (AQPN) and major facilitator superfamily (MFS). Black boxes surrounding entries in the heatmap indicate FPKM values that significantly differed (P ≤ 0.05) between a given pairwise treatment. Only genes showing significantly different mean FPKM values in at least one comparison are included in the heatmap.

