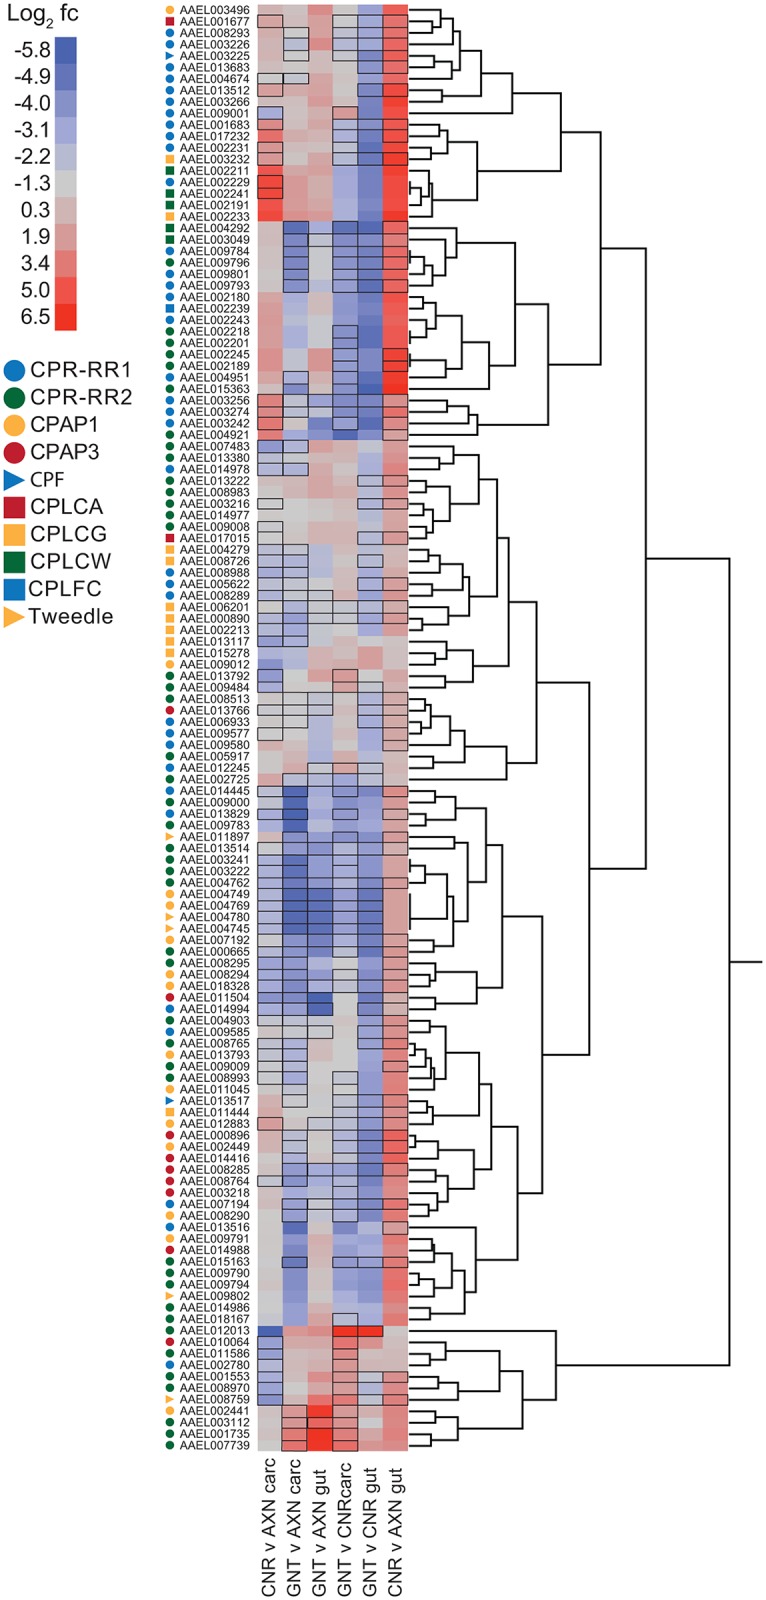
Fig 7. Hierarchical clustering analysis and heatmaps of expression for chitin-binding protein genes (CPs).

Symbols (colored circles, squares, and triangles) to the left of the heatmap identify the ten recognized CP families. Labeling of the heatmap is as described in Fig 3B with gene name listed by VectorBase accession number and CP family assignment indicated by symbol. Color range in the heatmap indicates log2 fold change (fc). Black boxes surrounding entries in the heatmap indicate FPKM values that significantly differed (P ≤ 0.05) between a given pairwise treatment.
