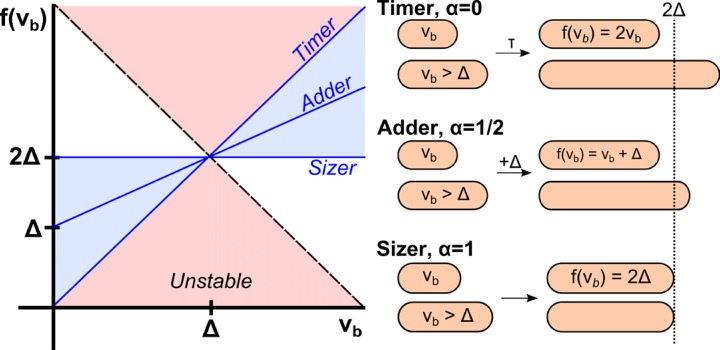
Figure 1. Phenomenological models for cell size control in bacteria.
This graph shows how the size at division, , depends on the size at birth (x-axis) in three different models. The parameter is related to the slope of the function, and can continuously interpolate across different models. Its value can be determined from single-cell level correlations (Amir, 2014; see Marantan and Amir, 2016 for a recent generalization of this phase diagram). As increases from 0 to 1, the correlations between mother and daughter cell sizes become weaker, yet the size distribution becomes narrower. The prevailing model for a critical size at initiation is effectively a ‘sizer’, and is inconsistent with recent experimental data supporting an ‘adder’.

