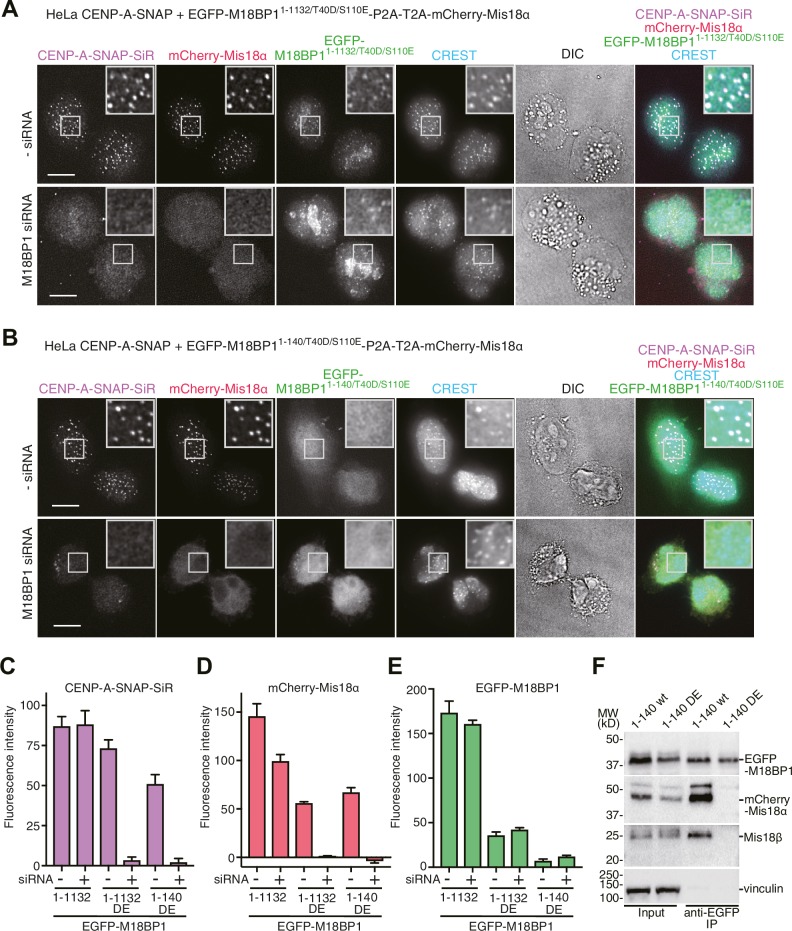
Figure 4. Functional analyses of M18BP1 T40D/S110E mutants in CENP-A recruitment.
(A, B) Representative images showing the fluorescence of CENP-A-SNAP-SiR, mCherry-Mis18α, and EGFP-M18BP1 variants in fixed HeLa cells treated as described in Figure 2A. Centromeres were visualized with CREST sera. Scale bars represent 10 µm. (C–E) Quantification of the fluorescence intensity of CENP-A-SNAP-SiR (panel C), mCherry-Mis18α (panel D), or EGFP-M18BP1 variants (panel E) on each centromere. The quantification was performed and is presented in the same way described in the legend of Figure 2E. DE, T40D/S110E. (F) Western blots of co-immunoprecipitation experiments using GFP-Trap_A beads. HeLa CENP-A-SNAP + EGFP-M18BP11-140-P2A-T2A-mCherry-Mis18α or EGFP-M18BP11-140/T40D/S110E-P2A-T2A-mCherry-Mis18α were analyzed.

