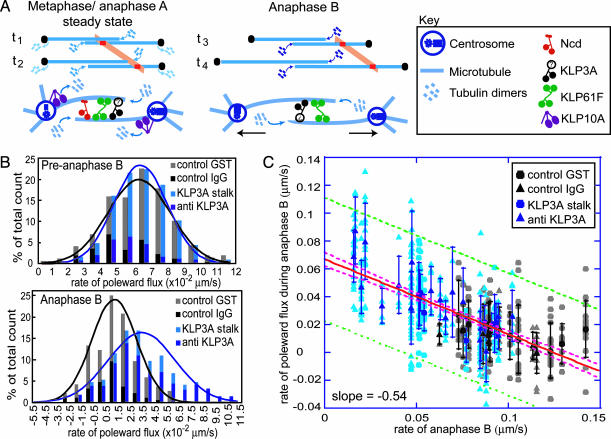
Fig. 1.
Qualitative model for anaphase B and experimental test of the model. (A) Dynamics of spindle poles (black dots), ipMTs (overlapping blue lines) that add or lose tubulin subunits (blue), and tubulin speckles (orange) at time points t1 and t2 (preanaphase B) and t3 and t4 (anaphase B). In preanaphase B, pole–pole spacing remains constant, and opposite end assembly/disassembly is associated with poleward flux (orange). In anaphase B, depolymerization at the poles ceases, and ipMT sliding drives pole–pole separation; thus, speckles move away from the equator at the same rate as the poles. In the molecular model of anaphaseB, the turning off of depolymerization at the poles by inhibiting KLP10A allows KLP61F-driven ipMT sliding to push the poles apart. KLP3A organizes ipMTs into bundles, whereas the braking action of Ncd is turned off before anaphase B onset. (B) Histograms of the rates of flux in preanaphase B (Upper) and anaphase B(Lower) spindles in control (gray) and KLP3A-inhibited (blue) embryos. The number of counts was normalized to the total number. Note that there are large variations in the flux rate, and when the mean is near zero, some values are negative. (C) During anaphase B, the rates of poleward flux and spindle elongation are linearly inversely related. Data points display the behavior of individual fluorescent tubulin speckles within individual spindles of control (gray) and KLP3A-inhibited (blue) embryos; darker symbols represent the mean for each spindle. The red line is the best fit to the data; the pink and green dashed lines are the 95% confidence intervals for the best fit line and data points, respectively.

