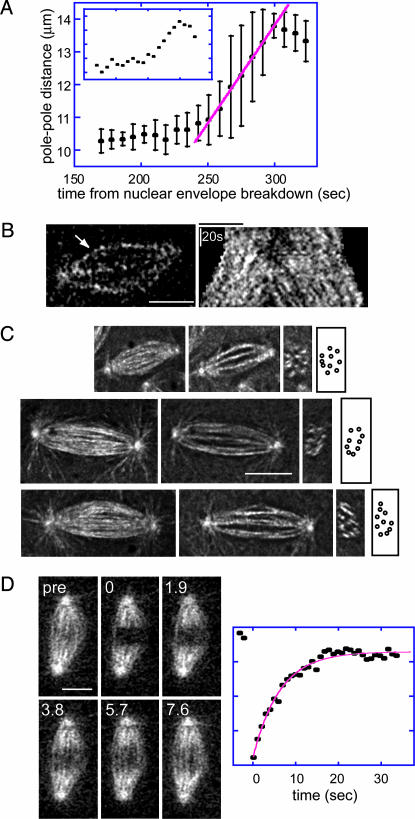
Fig. 2.
Organization and dynamics of ipMT bundles in Drosophila embryonic anaphase B spindles. (A) Pole–pole separation versus time during preanaphase B (160–250 sec) and anaphase B (250–300 sec). Spindle elongation is linear. Main graph, average data from multiple spindles; the standard deviation arises from variations in the linear rate between different spindles. (Inset) Typical spindle. Red line, regression line fit to the mean. (B) FSM of ipMT bundles. The kymograph (Right) during preanaphase B and anaphase B [for the bundle indicated by the arrow (Left) during anaphase B] shows that tubulin speckles flux away from the equator throughout. (C) ipMTs. Longitudinal projections (Left), XY sections (Center Left), transverse sections (Center Right), and cartoons of transverse sections (Right) reveal approximately nine ipMT bundles per spindle. (D) MT turnover determined by FRAP. Micrographs of a spindle before (pre) and after (time in seconds) photobleaching (Left) and the plot of fluorescence intensity (arbitrary units) versus time after photobleaching (Right) reveal that tubulin turnover in the central spindle is fast (recovery half time of 4.5 sec in this example). (Bar, 5 μm.)

