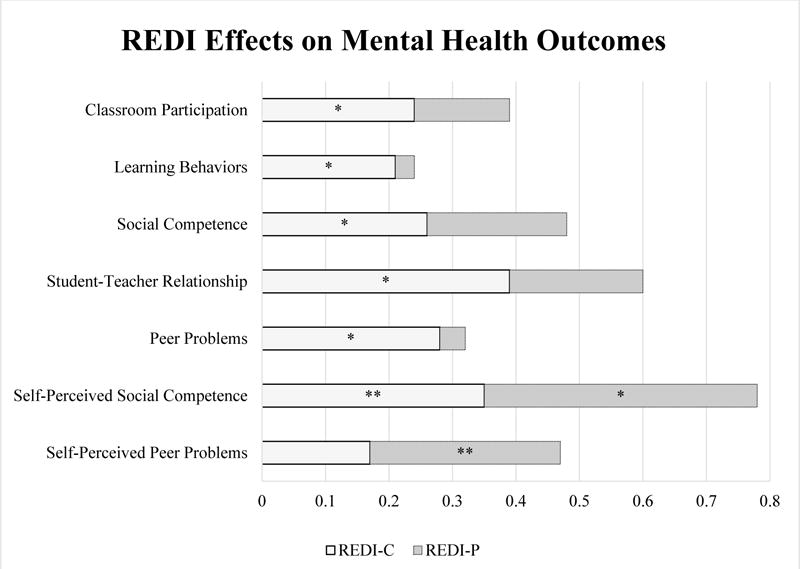
Figure 2. REDI-C and REDI-P Intervention Effects on Mental Health Outcomes.

** p < .01, * p < .05, + p < .10
Note: In this figure only, values for Peer Problems and Self-Perceived Peer Problems have been reverse scored, so that the positive intervention effects represent a reduction in actual problems. Light gray bars show effects for REDI-C relative to ‘usual practice’ Head Start, with significant effects on all measures except for self-perceived peer problems. Dark gray bars show additional effects for REDI-P plus REDI-C relative to REDI-C only, with significant effects for self-perceptions.
