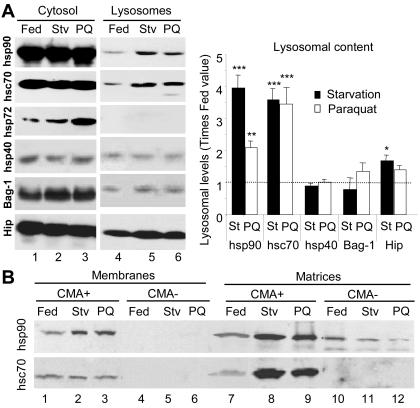
Figure 5.
Changes in lysosome-associated chaperones during mild oxidative stress. (A) Cytosol and lysosomes (75 μg of protein) isolated from normally fed, 48-h starved rats (Stv), or fed rats treated with paraquat (PQ) as labeled were subjected to SDS-PAGE and immunoblot for the indicated proteins. Right, densitometric quantification (mean + SE) of the chaperones in the lysosomal fraction in four immunoblots similar to the ones shown here. Levels in lysosomes from fed animals were given an arbitrary value of 1 (dotted line). *, differences compared with fed animals (*p < 0.1, **p < 0.05, ***p < 0.01). (B) Lysosomes with high (CMA+) and low (CMA-) activity for CMA (Cuervo et al., 1997) were isolated from the same groups of animals as detailed in A. After hypotonic shock and centrifugation, membranes and matrices (50 μg of protein) were separated and subjected to SDS-PAGE and immunoblot for hsc90 (top) or hsc70 (bottom).

