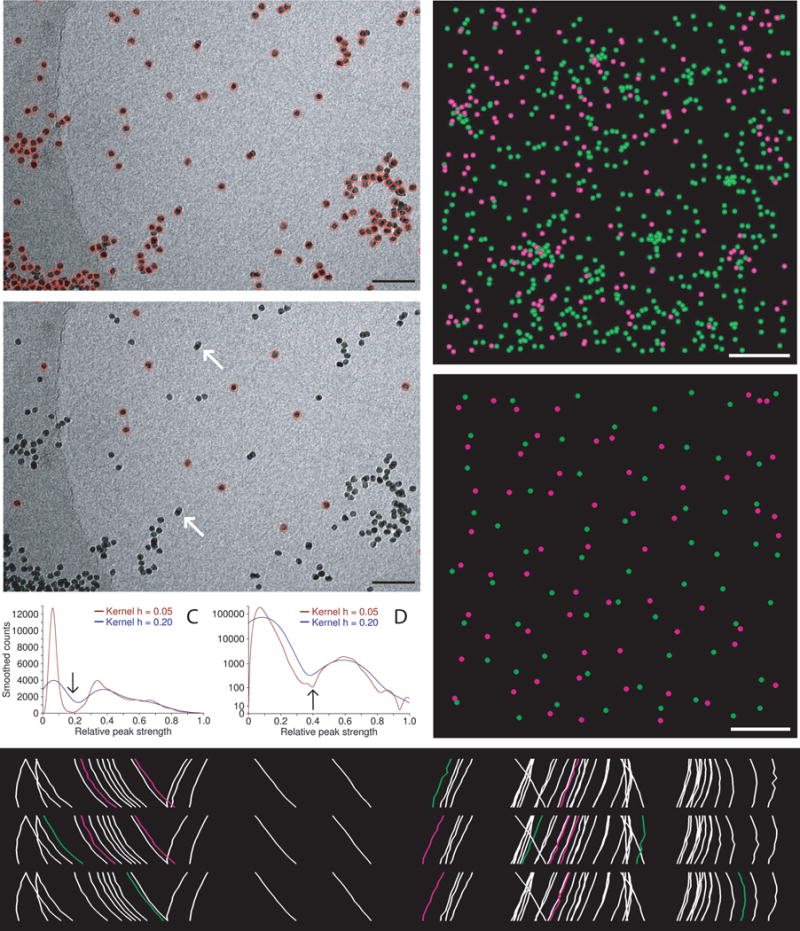
Fig 1.

Automatic selection of seed points for fiducial tracking. (A, B) Subarea from 0° image of tilt series from frozen-hydrated cell infected with bovine papilloma virus, acquired by Mary Morphew. Scale bars are 100 nm. A shows all beads found in the first step of the procedure; B shows the ones selected for the seed model. Arrows mark some partially overlapping, paired beads that were not selected because of their elongated appearance. (C, D) Smoothed histograms of the distribution of correlation peak strengths when finding beads in the tilt series used for parts (A) and (E), respectively. Histograms are smoothed by convolving with a kernel (1 − (x/h)2)3/(0.9143 h), where h is the half-width of the kernel. A dip between two maxima is first sought in a histogram with an h of 0.2 (blue curves) then its final location (arrow) is picked in a less smoothed histogram with an h of 0.05 (red curves). The histograms in (C) are atypical in having comparable area in the two modes because of the large clumps of gold; the histograms in (D) are typical and require a logarithmic scaling to show the mode for true beads clearly. (E) Side view of bead positions tracked through the same set of 11 images, but starting with beads found at three different tilt angles. Beads present in only one or two of the tracks are shown in green and magenta, respectively. The cryo tilt series of a Giardia cell was acquired by Cindi Schwartz. (F, G) Identified beads (F) and ones selected for the seed model (G) from a 3 × 3 montaged tilt series of a high-pressure frozen, freeze-substituted SVG-A cell infected by JC polyomavirus, acquired by Kimberly Erickson. Fig. S1 shows these points overlaid on tilt series images. Scale bars are 1 μm. In (F), beads have been identified as being on the bottom (green) or top (magenta) of the section using the Z positions solved during tracking through 11 images. In (E), the selected beads are well-distributed on both surfaces.
