
Fig 5.
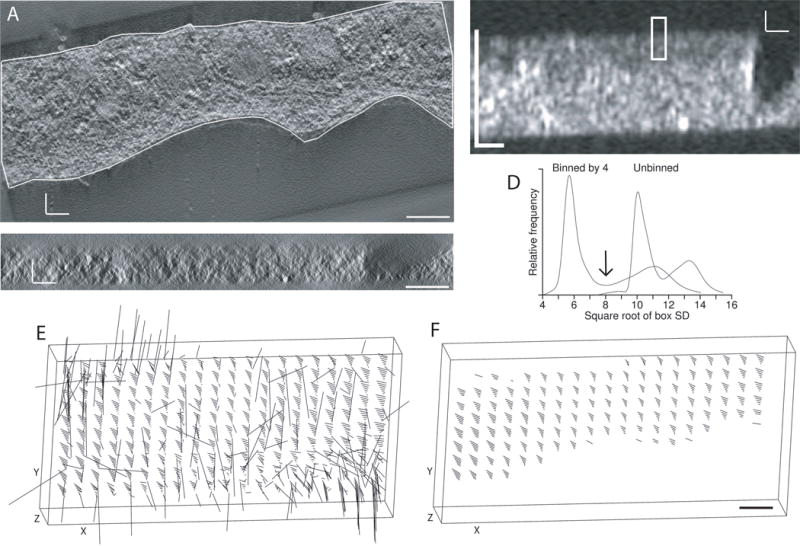
Detection of structure to automate the alignment of tomograms from tilt series taken around two axes. (A) X/Y slice through tomogram for one axis, acquired by Mary Morphew from a high-pressure frozen, freeze substituted melanoma cell. The boundary contour was drawn to exclude regions without sufficient structure for correlations between the two tomograms. Density is shown as positive to match the polarity of the SD display in (B). (B) X/Z slice through the middle of a volume of local standard deviations, where each voxel has the SD of an 8 × 8 × 2 box of voxels after binning the tomogram isotropically by 4, and the boxes are spaced 4 × 4 × 1 voxels apart. The rectangle indicates the size of a patch that would be correlated in 3D between the two tomograms. (C) Corresponding X/Z slice through the tomogram. (D) Distribution of box SD values from the unbinned and binned tomograms, showing better separation between the modes representing background and structure with binning by 4. The arrow indicates the threshold that would be chosen between structure and background. (E, F) 3-D displays of the tomographic volume showing the vectors of local shifts between the two volumes; lengths are exaggerated by 5. (E) Shifts between patches when correlating with neither the boundary contour model nor limits in Z as constraints (F) Shifts when the correlation search program skips all patches with a structure score of less than 50%. All scale bars are 200 nm.