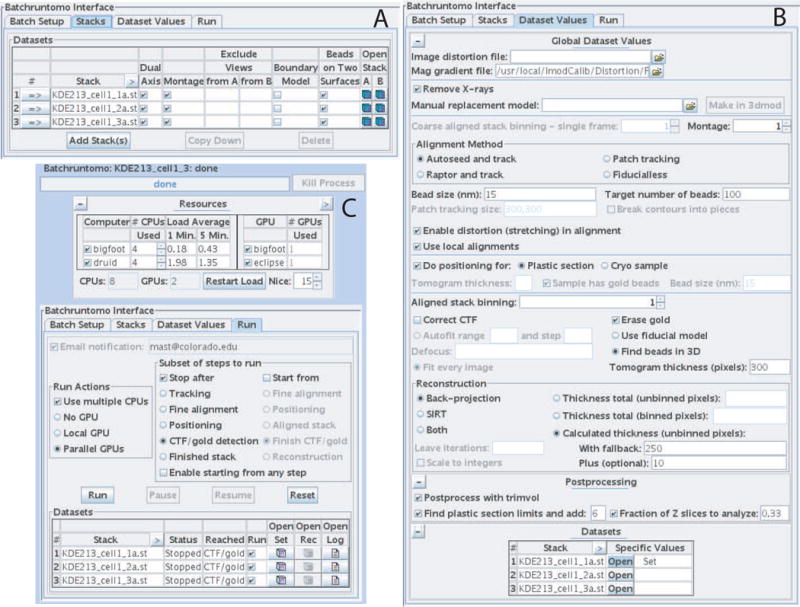
Fig 8.

Three tabs of the batch interface in the Etomo program. (A) The Stacks tab allows one to enter the tilt series to process and set some basic properties of them. (B) The Dataset Values tab presents the choices and most commonly needed parameters for processing. (C) The Run tab has a Resources table at the top for selecting computer cores and graphics processors to use, choices for stopping and restarting all data sets at certain points, and a table showing the status of each data set.
