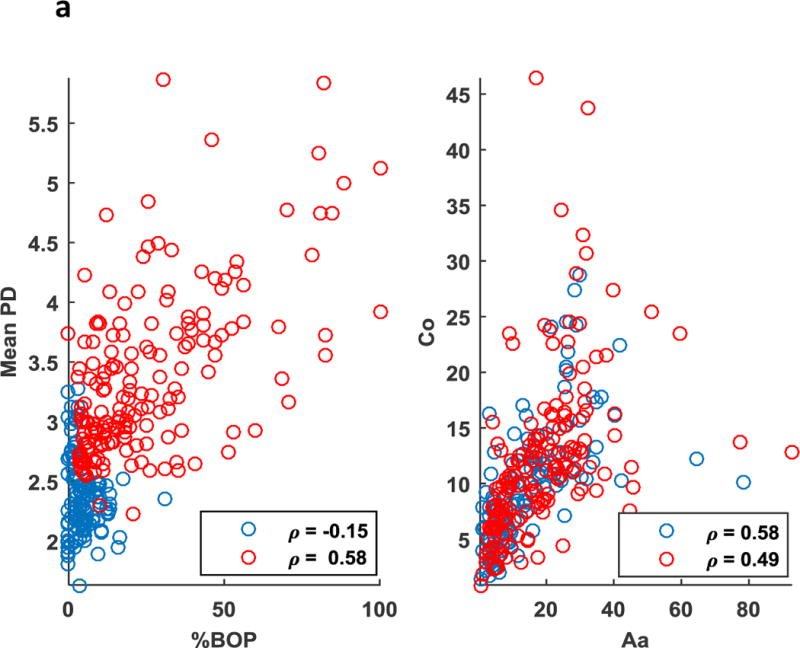
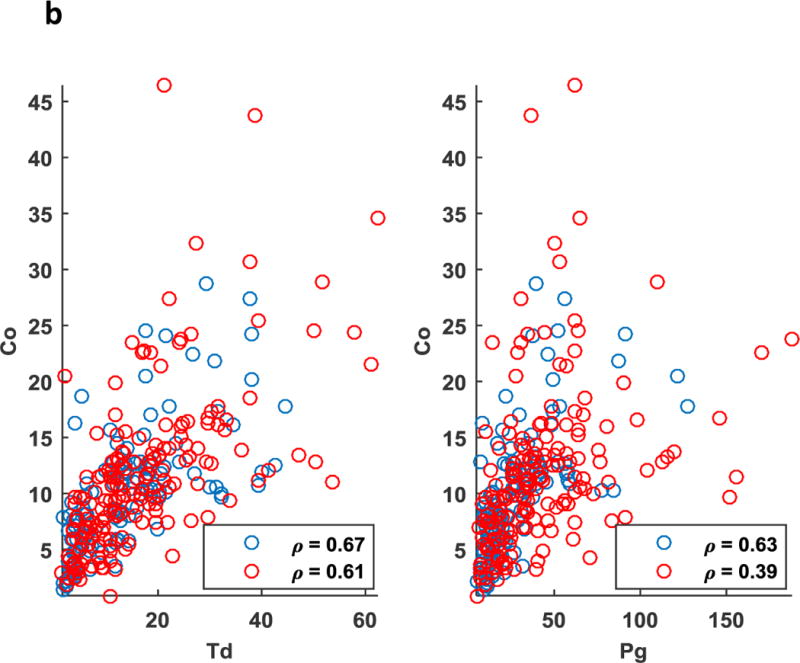
Figure 2.


(a) Scatter plot representing direct association between clinical parameters (Mean BOP) and (Mean PPD) was significant in the periodontitis (red, p<0.01) as opposed to the non-periodontitis (blue) smoking population. Association between antibody to a periodontal pathogen (Aa) and a commensal bacteria (Co) was significant in periodontitis (red, p<0.01), as well as the non-periodontitis (blue, p<0.01) smoking population. (b) Scatter plot representing direct association between antibody to a periodontal pathogens (Td and Pg) and a commensal bacteria (Co) was significant in periodontitis (red, p<0.01), as well as the non-periodontitis (blue, p<0.01) smoking population.
