
Fig. 3.
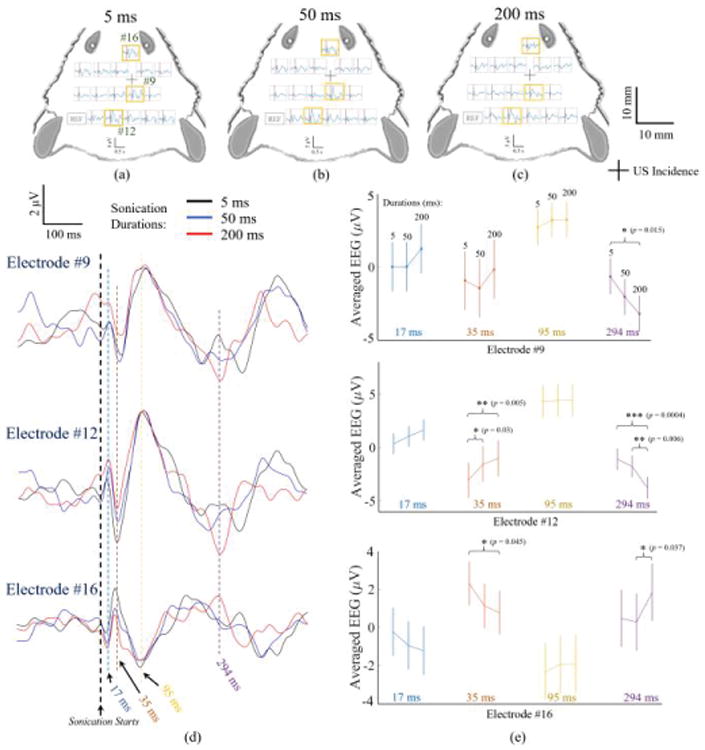
Averages of ultrasound-induced electrical potentials recorded with a 16-channel EEG in response to (a) 5 ms, (b) 50 ms, and (c) 200 ms sonication conditions in a top-view of the rat head. The channels indicated by the orange squares, i.e. electrode #9, #12, and #16 are shown at a higher gain in (d), in which the EEG recordings with three sonication durations are plotted for each electrode. The vertical dotted lines demonstrate the time points (17, 35, 95 and 294 ms) of interests at which the peaks of neural activity locate, and those average values and standard deviations are depicted in (e). The t-tests with p values indicate significant effects of sonication durations in each electrode as presented in (e).