
Fig. 5.
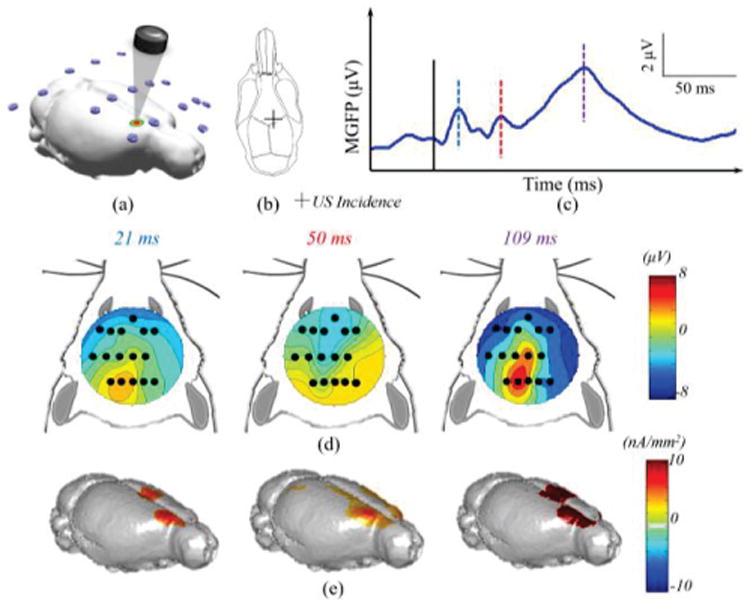
ESI neuroimaging of brain activity induced by the 200 ms low-intensity tFUS stimulation at the right anterior cortex in a rat. In this experiment, the tFUS transducer was placed over the right hemisphere as indicated in the 3D model (a), and the schematic diagram (b), where the cross depicts the placement of ultrasound transducer. The MGFP of the recorded EEG signal (c), in which the black solid line indicates the onset of sonication, and the blue, red and purple dashed lines represent the temporal instances of relative peaks in the MGFP (21 ms, 50 ms, and 109 ms). The topographical voltage maps (d) and source images (e) of these instances are depicted correspondingly.