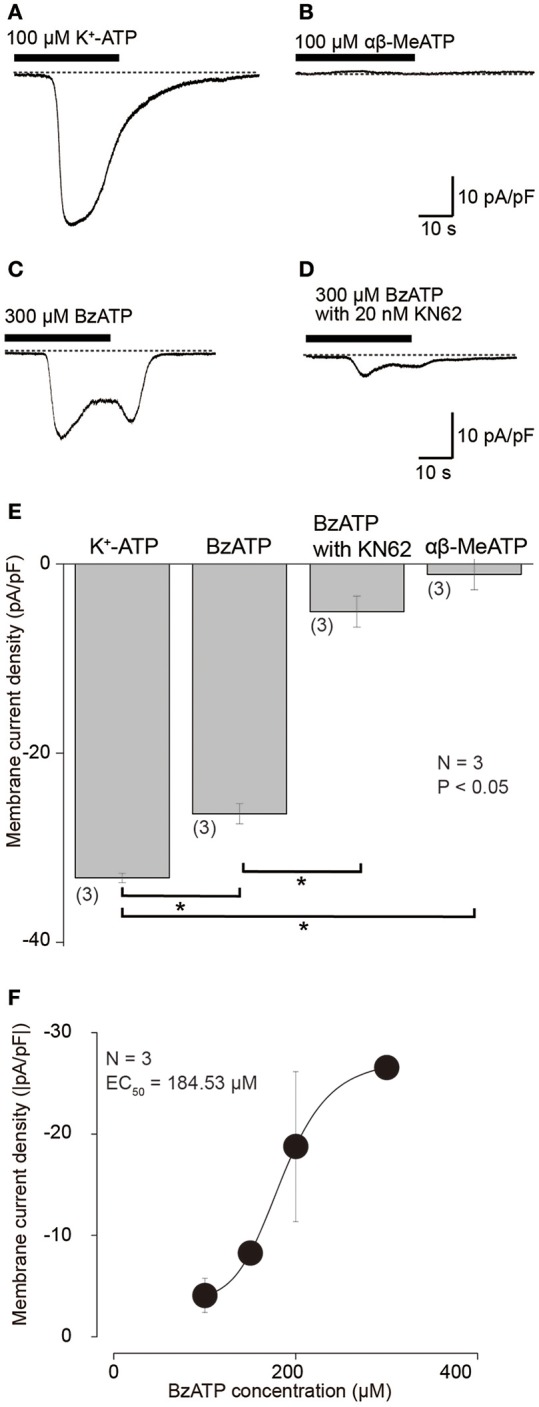
Figure 3.

Inward currents evoked by K+-ATP and BzATP, but not by αβ-MeATP. (A–D) Example traces of inward current evoked by 100 μM K+-ATP (A) or 300 μM BzATP (C). Application of 100 μM αβ-MeATP did not induce any currents (B). BzATP (300 μM) induced current was suppressed by 20 nM KN62 (D). These currents were recorded at Vh = −70 mV. (E) Bar graph shows a summary of the peak current densities elicited by application of each K+-ATP, BzATP, αβ-MeATP, as well as BzATP with KN62. Each bar indicates the mean ± SD of three separate experiments. Statistically significant differences between bars (shown by solid lines) are indicated by asterisks, *P < 0.05. (F) Dose-response relationship of absolute values of current density induced by BzATP in various concentrations. Each data point represents the mean ± SD from three cells. The curve (solid line) on a semilogarithmic scale was fitted to Equation (2). Applied concentration of BzATP is shown by x.
