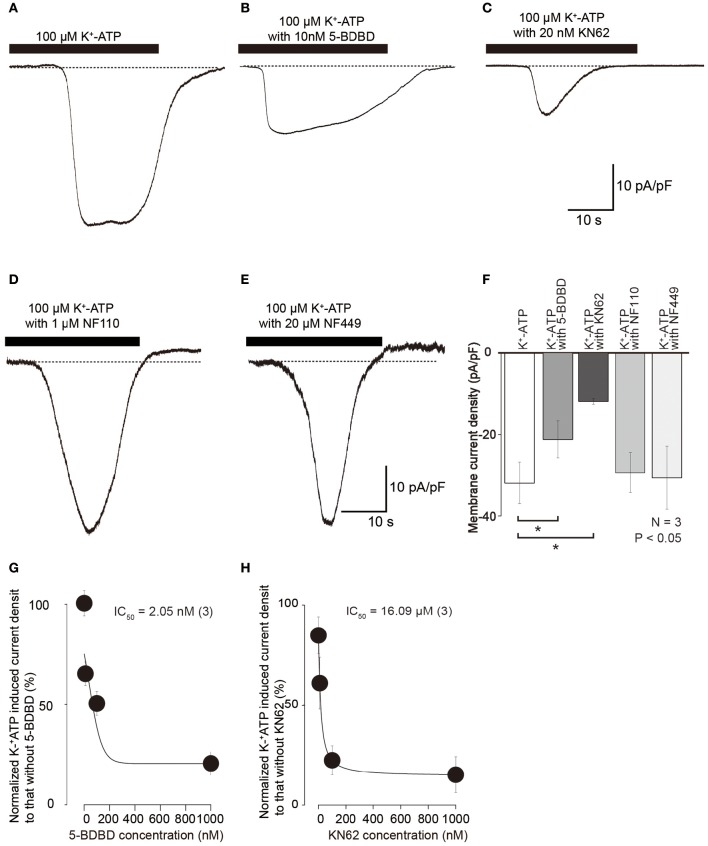
Figure 4.
K+-ATP-induced inward currents were inhibited by several selective P2X receptor agonists. (A–E) Example traces of inward currents induced by applications of 100 μM K+-ATP (A), 100 μM K+-ATP with 10 nM 5-BDBD (B), 100 μM K+-ATP with 20 nM KN62 (C), 100 μM K+-ATP with 1 μM NF110 (D), and 100 μM K+-ATP with 20 μM NF449 (E). (F) Bar graph summarizes current densities activated by 100 μM K+-ATP (most left) as well as 100 μM K+-ATP with 10 nM 5-BDBD (second left), with 20 nM KN62 (third left), with 1 μM NF110 (second right), and with 20 μM NF449 (most right). Each bar denotes the mean ± SD of three separate experiments. Statistically significant differences between bars (shown by solid lines) are indicated by asterisks, *P < 0.05. Significant differences were found in the K+-ATP-induced currents between in the presence and absence of KN62 or 5-BDBD, while we could not observe any significant differences in the peak current density in K+-ATP-induced currents between in the absence or presence of NF110 or NF449. (G,H) Effects of 5-BDBD (G) and KN62 (H) on the absolute values of current density induced by 100 μM K+-ATP. Each point indicates the mean ± SD of three separate experiments. The curve (solid line) on a semilogarithmic scale was fitted to Equation (2), showing dose dependence.

