Figure 6.
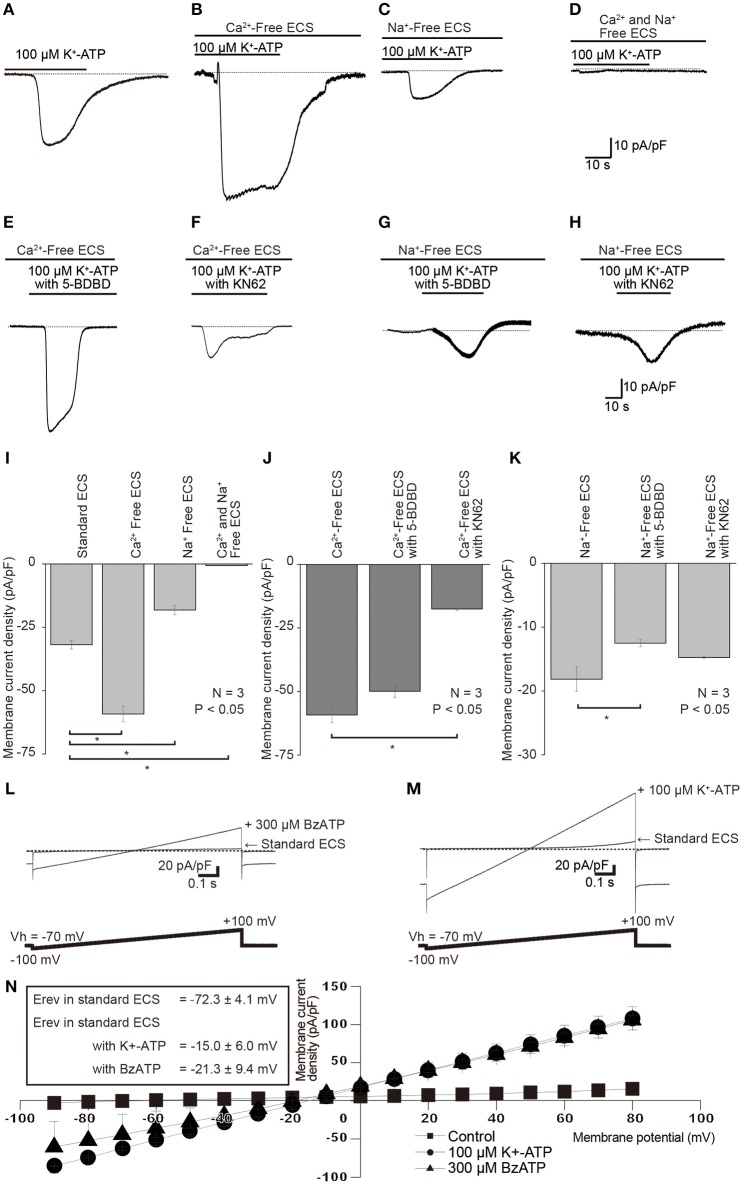
Effects of removals of extracellular cations, as well as of P2X receptor antagonist on each K+-ATP-induced Na+ or Ca2+ current. (A–D) Example traces of K+-ATP-induced inward currents are shown, which were obtained in the standard ECS (A), Ca2+-free ECS (B), Na+-free ECS (C), or Ca2+ and Na+-free ECS (D). (E,F) Example traces of K+-ATP (100 μM) induced currents that were recorded in the Ca2+-Free ECS with 10 nM 5-BDBD (E) or 20 nM KN62 (F). (G,H) Example traces of K+-ATP (100 μM) induced inward current, which were recorded in Na+-free ECS with 10 nM 5-BDBD (G) or 20 nM KN62 (H). (I) Bar graph shows the peak current densities evoked by 100 μM K+-ATP in the standard ECS, Ca2+-Free ECS, Na+-Free ECS, or Ca2+- and Na+-Free ECS. (J) Summary bar graph shows the peak current densities evoked by 100 μM K+-ATP in Ca2+ free ECS without or with 20 nM KN62 and 10 nM 5-BDBD. (K) Summary bar graph shows the peak current densities evoked by 100 μM K+-ATP in Na+ free ECS without or with 20 nM KN62 and 10 nM 5-BDBD. Each bar denotes the mean ± SD of three separate experiments. Statistically significant differences between bars (shown by solid lines) are indicated by asterisks, *P < 0.05. (L,M) I–V relationships of the currents induced by P2X receptor agonists. Voltage-ramp protocol from −100 to +100 mV (0.2 mV/ms) at a Vh of −70 mV was applied to the cells (bottoms in L,M). Traces show the example currents, which were recorded in standard ECS and in standard ECS with 300 μM BzATP (L) or 100 μM K+-ATP (M). (N) I–V relationships for ramp current without (closed squares) or with 100 μM K+-ATP (closed circles) and 300 μM BzATP (closed triangles). The data points show the mean ± SD of three separate experiments. Reversal potential (Erev) for the currents were −72.3 ± 4.1 mV in standard ECS, −15.0 ± 6.0 mV in the ECS with K+-ATP, or −21.3 ± 9.4 mV in standard ECS with BzATP.

