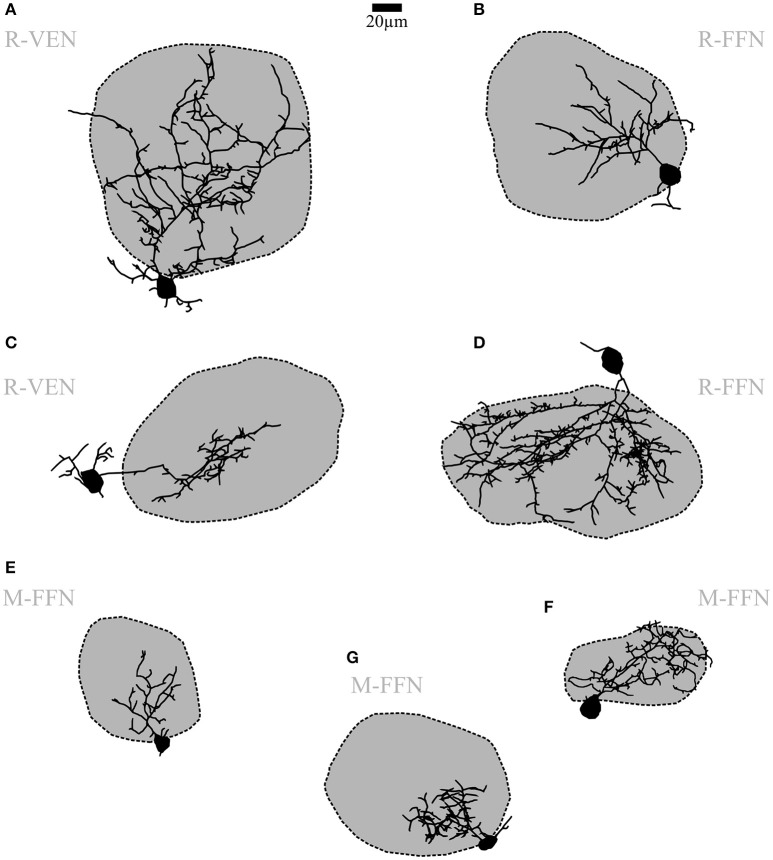
Figure 3.
Periglomerular cells (PGCs). (A–G) Maximal z-projections of reconstructions of individual representative PGCs with their corresponding contacted glomeruli. The dark shading indicates that dendrites contact the intraglomerular neuropil. Note the differing fractions of intraglomerular arborization with sparse or no juxtaglomerular processes, as well as the differing degree of branching and spine density across individual cells. R-VEN, VGAT-Venus+ cells in juvenile rats; R-FFN, FFN102+ cells in juvenile rats; M-FFN, FFN102+ cells in adult mice. Scale same size as in Figure 2.

