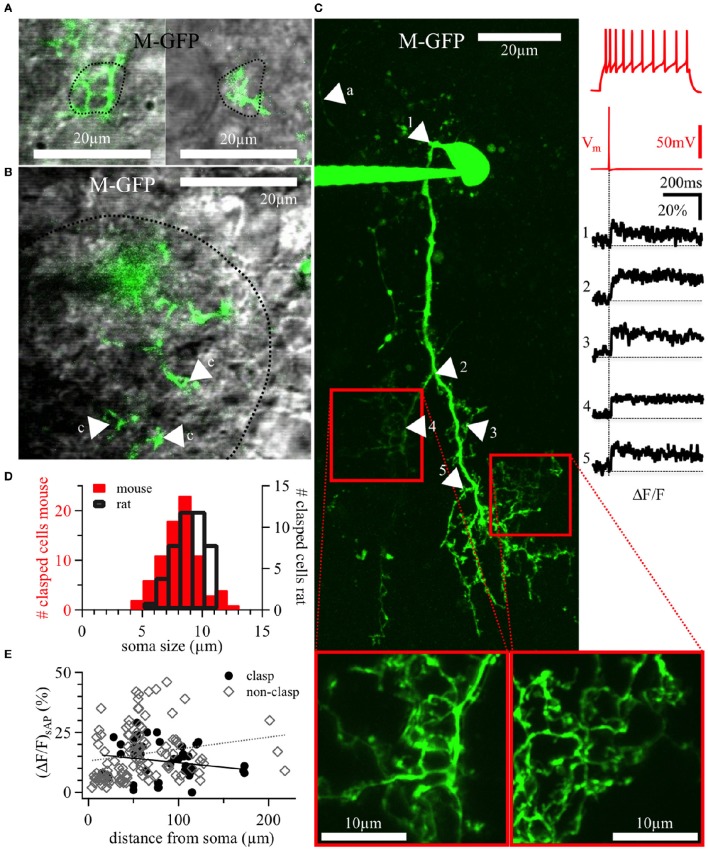
Figure 5.
DAT+ clasping cell dendrites: Clasp structures and AP-evoked Ca2+ signals. (A) Two different clasping structures around cell bodies (left and right), with a dotted line indicating the somatic outline of the clasped cell—both structures are from a 20 weeks old DAT-GFP mouse (cell shown in panel C, the left clasping structure corresponds to the arrowhead number 4). (B) Exemplary, tight clasping structures (labeled “c”) within the glomerular neuropil (DAT-GFP mouse, 17 weeks old), with a dotted line indicating the glomerular border. (A,B) Show single z-plane scans from the green channel overlaid with the trans-IR channel in gray. (C) Maximal z-projection of the OGB-1 filled CC from Figure 2D (insets at bottom: magnified rescans of clasping structures). Numbered arrows in the scan correspond to the locations of the numbered averaged ΔF/F transients on the right, time-locked to the evoked somatic action potential (red trace directly above the black ΔF/F traces). The voltage recording on the top right shows this cell's accommodating firing pattern upon step depolarization (+90 pA current injection). In the scan, the arrow labeled with “a” points out a putative stained axon. It is thinner than the other, presumably dendritic, structures and bears no visible spines or clasps. (D) Distribution of the size of somata surrounded by clasps in juvenile rats (n = 45 clasped somata) and adult mice (both WT and DAT-GFP; n = 79 clasped somata). (E) Individual ΔF/F measurements versus the distance of their dendritic location from the soma (in n = 11 DAT-GFP+ mouse CCs; within clasps: black dots, n = 45 locations; within non-clasping dendrites: gray diamonds, n = 110 locations). No significant correlations emerged. M-GFP, DAT-GFP+ cells in adult mice.

