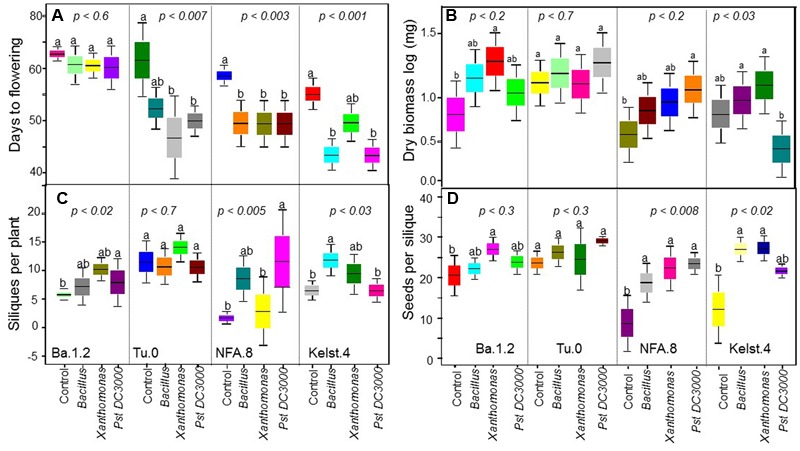
FIGURE 2.

Impact of individual bacterial species on the plant performance. Effect of bacterial monoculture treatments on (A) days to flowering (DF), (B) dry biomass per plant, (C) siliques per plant (SPP), and (D) seeds per silique (SPS) production in all Arabidopsis accessions (NFA-8, Ba1-2, Kelst-4, and Tu-0). Sample size varied from 6 to 15 plants (e.g., Kover and Schaal, 2002). Error bars represent means ± 1SE. The significant differences were determined by ANOVA followed by Tukey’s, and Fisher’s tests. Lack of shared letters above the bars indicate significant difference.
